Featured Article
Celiac disease (CD), a chronic enteropathy of the small intestine, affects about 1% of the population and is caused by the ingestion of gluten-containing cereals (wheat, rye and barley) in persons with a certain genetic predisposition.1 Gluten proteins can be classified into two fractions according to solubility. The predominantly monomeric prolamin fraction (called gliadin in wheat) is soluble in aqueous alcohols such as 60% (v/v) ethanol, while the glutelin fraction (called glutenin in wheat) is insoluble in aqueous alcohols, because these polymeric proteins are linked by intermolecular disulfide bonds. Glutenins can only be solubilized in aqueous alcohols after reduction of the disulfide bonds.
Foods labeled gluten-free must not exceed a gluten content of 20 mg/kg in the final product.2 Enzyme-linked immunosorbent assays (ELISAs) are most commonly used in regulatory compliance testing, yet gluten analysis by ELISA has some limitations, that is, results vary among kits because each has a specific extraction protocol, reference material, antibody specificity and assay procedure.3 Most ELISA antibodies have a high affinity to gliadins and a low affinity to glutenins, even though glutenins are also known to cause CD. Due to lack of a comprehensive method targeting all gluten proteins, the gliadin content is analyzed and then multiplied by a factor of 2, because the ratio of gliadins-to-glutenins (glia/glut) is generally taken as 1.2 The typical glia/glut ratio is between 1.5 and 3.1 in wheat flours,4 and this duplication tends to result in an overestimation of gluten contents, which introduces a certain safety factor for CD patients. Wheat starches (WSt), however, are a special case: the processing steps to remove gluten may result in glia/glut ratios down to 0.3,5 which may in turn lead to an underestimation of gluten contents even after duplication. Therefore, the low affinity of the antibodies to glutenins results in a substantial measurement uncertainty when quantitating gluten in WSt. A method based on gel-permeation high-performance liquid chromatography with fluorescence detection (GP-HPLC-FLD) was developed to address this issue and detects gliadins and glutenins in WSt.
GP-HPLC-FLD method
Determination of the fluorescence excitation and emission maxima of gluten proteins found the wavelengths to be 277 nm and 345 nm, respectively. A Merck-Hitachi LaChrom Elite HPLC system (Tokyo, Japan) was equipped with a Biosep-SEC-S3000 column (Phenomenex, Torrance, Calif.) with acetonitrile/water (1+1, v/v) containing 0.1% trifluoroacetic acid as elution solvent at a flow rate of 0.3 mL/min. The fluorescence detector was set to 277/345 nm as excitation/emission wavelengths to detect gliadin, glutenin and total gluten fractions. Fourteen samples of WSt declared gluten-free (GfWSt1-14) were obtained from starch manufacturers. The GfWSt samples (1 g) were preextracted twice with 5 mL salt solution (0.4 mol/L NaCl, pH 7.6) to remove residual proteins soluble in Improved Method to Quantitate Gluten in Purified Wheat Starch dilute saline (albumins/globulins). After centrifugation, the starch residue was extracted once with 5 mL 60% (v/v) ethanol (→ gliadin extract).
Following another centrifugation step, the starch residue was extracted once with 5 mL gluten extraction solution (2-propanol/phosphate buffer pH 7.6, 1+1, v/v, containing 10 mg/mL dithiothreitol under nitrogen) for 30 min at 60 °C in a water bath (→ glutenin extract). In a separate experiment, total gluten extract was obtained in the same way, except the gliadin extraction step was omitted. All extracts were filtered and analyzed by GPHPLC-FLD. Matrix calibration was chosen for quantitation using one GfWSt as matrix, which was extracted five times with gluten extraction solution as described above to ensure it was completely devoid of gluten. This matrix was then spiked with defined amounts of wheat flour with known gluten content to yield 16, 31, 79, 157 and 315 mg gluten/kg. The six calibration samples (GfWSt and GfWSt + 16/31/79/157/315 mg/kg) were extracted together with the samples on the same day using the same procedure. The gluten contents of the samples (GfWSt1-14) were also analyzed by R5 ELISA (RIDASCREEN Gliadin, R-Biopharm, Darmstadt, Germany). All extractions were done in triplicate, and limits of detection (LOD), limits of quantitation (LOQ), precision and recovery were determined.6
Quantitation of gliadin, glutenin and gluten in wheat starches
Gliadin, glutenin and gluten extracts of GfWSt and the five spiked samples (GfWSt and GfWSt + 16/31/79/157/315 mg gluten/kg) were analyzed by GP-HPLC-FLD (Figure 1). R2 values above 0.995 were obtained for the resulting calibration lines by plotting the peak areas of the FLD against the calculated gliadin, glutenin and gluten contents. Peak area of the unspiked GfWSt matrix was smallest for the gliadin extract and highest for the gluten extract due to some non-gluten proteins (e.g., starch synthase) located inside the starch granules that were coextracted after starch gelation at 60 °C. The y-intercept of the calibration lines allowed appropriate correction for those starch-associated non-gluten proteins that could not be separated by GP chromatography, because their molecular weights (Mr ≈ 67,000) were within the range of gluten proteins (Mr ≈ 30,000–86,000).
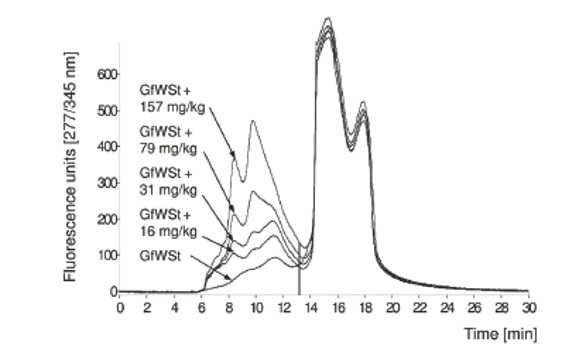 Figure 1 – GP-HPLC-FLD chromatogram showing the gluten extracts of gluten-free GfWSt and GfWSt samples spiked with wheat flour for matrix calibration to obtain 16, 31, 79 and 157 mg gluten/kg (GfWSt + 16/31/79/157 mg/kg). The peak between 6.5 and 12.8 min was used for gluten quantitation.
The gliadin contents of GfWSt1-14 analyzed by GP-HPLC-FLD ranged from below 5.4 mg/kg (LOQ of the GP-HPLC-FLD method for gliadin) to 17.7 mg/kg (GfWSt12) (Figure 2). Four of the 14 GfWSt contained gliadin below the LOQ. The glutenin contents of GfWSt1-14 were between below 10.2 mg/kg (LOQ of the GP-HPLC-FLD method for glutenin) and 58.9 mg/kg (GfWSt6). Only two of 14 GfWSt had glutenin contents below the LOQ, but one sample had gliadin and glutenin contents below the respective LOQs (GfWSt2). The glia/glut ratios ranged from 0.19 to 0.52, which indicates that gliadins had been removed more efficiently during industrial starch purification than glutenins. This result corroborated earlier findings in which gliadin depletion during repetitive washing steps had been shown during laboratory-scale preparation of WSt.5 Total gluten contents of GfWSt1-14 were in the range below 17.2 mg/kg (LOQ of the GPHPLC-FLD method for gluten) to 69.0 mg/kg. According to GP-HPLC-FLD, only two of the 14 samples were gluten-free (GfWSt1 and 2), and the other 12 samples had gluten contents above the regulatory threshold of 20 mg/ kg and up to 69.0 mg/kg, which was mostly due to the presence of glutenins.
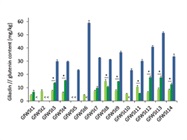
 Figure 2 – Gliadin content determined by ELISA and gliadin and glutenin contents determined by GP-HPLC-FLD in GfWSt1-14. Data are presented as mean value + standard deviation (n = 3). Asterisks indicate significant differences between gliadin contents determined by ELISA and GP-HPLCFLD.
 “
Comparison of GP-HPLC-FLD and ELISA
The results obtained after GP-HPLC-FLD analyses were compared to those by R5 ELISA, the analytical method for gluten determination recommended by the Codex Alimentarius.2 One fundamental difference between the methods is that the ELISA mainly detects gliadins and the gluten content is calculated as gluten = gliadin × 2. Gluten content quantitated by GP-HPLC-FLD is the actual sum of both fractions, i.e., gluten = gliadin + glutenin. There were no significant differences between ELISA and GP-HPLC-FLD regarding gliadin contents in two of the 14 GfWSt; in four cases, one or both methods indicated gliadin values below the respective LOQ. In the remaining eight cases, the GP-HPLC-FLD method found significantly higher gliadin contents than the ELISA in six cases, but lower gliadin contents in two. Twelve of the 14 GfWSt were gluten-free as per the ELISA (<20 mg/kg), and two samples had slightly higher contents (GfWSt8: 29.7 ± 2.7 mg/kg and GfWSt11: 21.2 ± 2.2 mg/kg). Only two of the 14 GfWSt were gluten-free, as described above, because it was possible to detect glutenins.
Conclusion
These findings emphasize the need for analytical methods that enable quantitation of gluten as the sum of both gliadins and glutenins. GP-HPLC-FLD revealed that non-negligible amounts of glutenins were present in GfWSt, which also resulted in higher gluten contents compared to ELISA in 11 of 14 samples. One limitation of the GP-HPLC-FLD method was its low selectivity, which may explain why it is restricted to the analysis of gluten in raw materials such as starches and flours, because proteins from other sources (e.g., milk, egg, soy) with similar molecular weights commonly found in gluten-free foods may interfere. Despite this drawback, the new HPLC method may be applied as a confirmatory method to ELISA, particularly to check for the presence of glutenins in WSt rendered gluten-free.
References
- Ludvigsson, J.F.; Leffler, D.A. et al. The Oslo definitions for coeliac disease and related terms. Gut 2013, 62, 43–52.
- Codex Standard 118-1979, 2015. Codex Alimentarius Commission. Rev. 1, Amendment 2.
- Scherf, K.A. Gluten analysis of wheat starches with seven commercial ELISA test kits—up to six different values. Food Anal. Method. 2017, 10, 234–46.
- Wieser, H. and Koehler, P. Is the calculation of the gluten content by multiplying the prolamin content by a factor of 2 valid? Eur. Food Res. Technol. 2009, 229, 9–13.
- Scherf, K.A. Impact of the preparation procedure on gliadin, glutenin and gluten contents of wheat starches determined by RP-HPLC and ELISA. Eur. Food Res. Technol. 2016, 242, 1837–48.
- Scherf, K.A.; Wieser, H. et al. Improved quantitation of gluten in wheat starch for celiac disease patients by gel-permeation high-performance liquid chromatography with fluorescence detection (GP-HPLC-FLD). J. Agric. Food Chem. 2016, 64, 7622–31.
The authors are with Deutsche Forschungsanstalt für Lebensmittelchemie (German Research Center for Food Chemistry), Leibniz Institut, LiseMeitner-Str. 34, 85354 Freising, Germany; tel.: +49 8161 712927; e-mail: [email protected]; www.dfal.de