Featured Article

Fermentation, distillation and aging processes1 play a key role in developing the unique chemical composition and flavor of whiskey, resulting in a product with a high degree of chemical variability and commercial value. A significant problem in whiskey production is adulteration. This may include adding the major chemical components of a product to less expensive, or inferior, spirits, or coloring a product to falsify age and thus add value.
Chemical profiling using GC/MS is an effective technique for identifying adulterated product. This approach provides a powerful solution when used within a comprehensive informatics solution such as the Thermo Scientific SampleManager (Thermo Fisher Scientific, Waltham, Mass.), comprising a laboratory information management system (LIMS), chromatography data system (CDS), scientific data management system (SDMS) and electronic laboratory notebook. The compliance rules and instrument calibration associated with these electronic workflows provide results that are legally defensible, while direct integration with the raw data produced by these analytical techniques ensures traceable results.
GC/MS for whiskey analysis
Using full-scan Orbitrap MS (Thermo Fisher Scientific) to obtain high-resolution accurate mass measurements, in combination with principal component analysis (PCA) and structural elucidation tools, the chemical signatures of nine whiskey samples of various origins, ages and types were identified (Table 1). Samples were analyzed using a Thermo Scientific Q Exactive GC system with a hybrid quadrupole-Orbitrap mass spectrometer. The system was operated in electron ionization (EI) full-scan mode at a resolving power of 60,000 FWHM at m/z 200. Additional experiments were performed using positive chemical ionization with methane as reagent gas at a flow rate of 1.5 mL/min to obtain information on the molecular ions and to support the identification of unknown component peaks. Chromatographic separation was done using a Thermo Scientific TRACE 1310 GC instrument. Analytical conditions and instrument parameters are shown in Table 2.
Table 1 – Whiskey samples included in study

Table 2 – GC, injector and MS parameters

Sample preparation
To prepare samples for GC analysis, 3 mL of whiskey sample was mixed with 10 mL of distilled water and shaken with 15 mL of ethyl acetate. The organic layer was filtered through 3 g of sodium sulfate. Ethyl acetate extract was evaporated under a gentle stream of nitrogen at room temperature. The evaporated extract was redissolved in 0.5 mL of ethyl acetate and transferred into the GC vial. A composite (pool) sample was also prepared by pipetting 50 μL of each whiskey extract into a single GC vial. To eliminate background systematic peaks, an ethyl acetate blank sample was analyzed. Each sample, including the pool sample, was injected four times and analyzed in a random order.
Identifying sample differences using PCA
Four replicate full-scan chromatograms were obtained for each whiskey sample. The complete data set, including the nine samples and pool sample, was processed for component extraction and statistical analysis using Thermo Scientific SIEVE 2.2 software. Retention time correction and peak detection were performed by the software, followed by statistical analysis. The resulting PCA plot (Figure 1) shows how each replicate set clusters together, with the pool sample replicates located near the center of the plot.
 Figure 1 – PCA of nine whiskey samples with four replicate injections per sample.
The cluster of data points for the bourbon sample (sample 2295) in the PCA plot differed from most of the other whiskey samples. Using PCA analysis, it was possible to order the list of 4841 identified component peaks based on statistical significance (p value). This revealed that the GC peaks that contributed most significantly to this difference were either unique or elevated in sample 2295. To identify the chemical species that corresponded to these peaks, the EI spectrum for each peak was compared against the NIST mass spectral library to produce possible hits ranked by a search index score and a high-resolution filtering score (the percentage of the spectrum that could be explained by the chemical formula). Accurate mass data was used to further confirm these tentative identifications.
One peak, at a retention time of 13.6 min in the GC chromatograms, was present in the bourbon sample to a much greater extent than the single-malt whiskey samples. Using the above approach, this component was identified as trans-beta-ionone, a decomposition product of carotene. This finding is consistent with the fact that bourbon is brewed from corn, a crop that contains over seven times more beta-carotene than the barley that is used to produce single-malt whiskey.2
Identifying compounds with no spectral library match
In cases in which there was no library match from the EI spectrum, the PCA spectrum was used to identify the [M+H]+ and [M+C2H5]+ adducts and deduce the chemical formula of the parent molecule. This was required to establish the identity of a chromatogram signal at 18 min, which showed elevated levels in sample 2295.
The Orbitrap system was used to narrow the list of possible chemical formulae. For example, when a 10-ppm mass-accuracy window was used, nine possible formulae were proposed for the [M+H]+ ion of m/z 241.10699 using the elements carbon (1–50), hydrogen (1–100), nitrogen (1–5), oxygen (1–10) and chlorine (1–10). By way of contrast, a 1-ppm window resulted in only one possible formula, C12H17O5. This identification was further supported by the molecular ion m/z of 240.09924 obtained from the EI spectrum (Figure 2). The ChemSpider chemical database (Royal Society of Chemistry) was used to produce a list of potential structures corresponding to C12H17O5. Thermo Fisher Mass Frontier 7.0 software was then used to theoretically fragment these proposed compounds and match these to the fragments in the EI spectrum. These fragments were used to rule out potential compound hits for C12H17O5, resulting in a single compound: 3-carboxy-4-methyl-5-propyl-2-furanopropanoic acid.
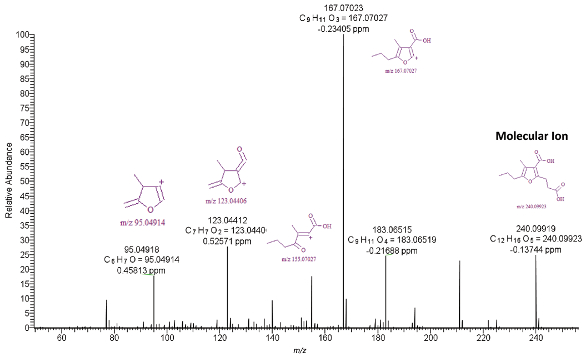 Figure 2 – EI spectrum for peak at 18 min where no library match was made. Peaks are labeled with structure, formula and mass error in ppm. The sub-1 ppm mass errors provide confidence in the proposed identification of 3-carboxy-4-methyl-5-propyl-2-furanopropanoic acid. Structures were identified using Mass Frontier 7.0.
Identifying components associated with whiskey aging
This approach was also used to identify compounds contributing to differences between whiskies from a single distillery, but with different ages or aging processes. Replicate data for a 12-year-old sample (2263), 18-year-old sample (2264) and sample aged in three barrels (2265) was processed using SIEVE software (Figure 3), and the most statistically significant peaks were identified. Thermo Scientific TraceFinder software was then used to perform spectral matching to limit the list of possible compounds based on the search index and scoring the proportion of the spectrum that could be explained by the compound based on accurate mass.
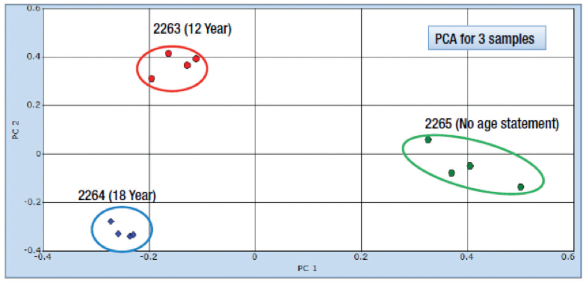 Figure 3 – PCA chart generated for whiskies from the same distillery but with a different age declaration.
Hydroxymethyl furfural (HMF) was identified as the largest contributor to differences associated with the whiskey that was aged in three different barrels. The heat charring of oak bourbon barrels is known to generate high levels of HMF, and the elevated levels may be explained by the length of time the sample was in contact with the wood surface.3,4
Conclusion
GC/MS used with statistical analysis and structural elucidation software rapidly determines the complex chemical composition of whiskies. The method reported identified chemical differences between whiskies of different origin, age and type. Combined with an integrated informatics solution, this approach may be used by manufacturers or contract testing laboratories to confirm product authenticity.
References
- Poisson, L. and Schieberle, P. Characterization of the most odoractive compounds in an American bourbon whisky by application of the aroma extract dilution analysis. J. Agricul. Food Chem. 2008, 56, 5813–9.
- LaRoe, E.G. and Shipley, P.A. Whiskey composition: formation of alpha and beta ionone by the thermal decomposition of beta carotene. J. Agricul. Food Chem. 1970, 18, 174–5.
- Piggott, J.R.; González-Viñas, M.A. et al. Effect of Chill Filtration on Whisky Composition and Headspace in Flavour Science: Recent Developments; Taylor, A.J. and Mottram, D.S., Eds. The Royal Society of Chemistry: Cambridge, U.K., 1996, pp 319–24.
- Hui, Y.H.; Meunier-Goddik, L. et al. Handbook of Food and Beverage Fermentation Technology. CRC Press: Boca Raton, Fla., 2004.
Dominic Roberts and Paul Silcock are with Thermo Fisher Scientific, Manor Park, Tudor Rd., Cheshire, Runcorn WA7 1TA, U.K.; tel.: +44 1928 534000; e-mail: [email protected]; www.thermofisher.com. Jana Hajslova and Jana Pulkrabova are with the University of Chemistry and Technology, Prague, Czech Republic.