Featured Article

To ensure the quality and safety of foods and beverages, analysts and lab personnel must identify components to determine if they are contaminants that need to be removed or are acceptable by-products of the food production process. Fourier-transform infrared (FTIR) microscopy is a powerful method for identifying traces of material such as particulates and oil droplets. These analyses typically involve the detection of visible irregularities with an approximate lower limit of 25 μm. Two sets of analyses are presented—one involving liquid filtration and the other examining particulate residues in food items—using a simple-to-operate FTIR microscope and attenuated total reflection (ATR) sampling.
Infrared microscopy for food and beverage quality control
The food and beverage industry processes massive quantities of material for direct consumption or as an ingredient for further processing. A single milk truck may transport about 36,000 liters (around 9000 gallons) of liquid milk per load, and even small dairy operations take delivery from several trucks daily. Food processing of all kinds brings the product into contact with containers, impellers, piping, seals, and lubricants.
Modern processing plants are extremely careful to ensure that all surfaces food comes into contact with are inert, nontoxic, and scrupulously clean. Even so, the food may pick up small amounts of material, including microparticles of polymers from plastic impellers, lubricants, oils needed for production, or burnt materials from cooking.
For many beverages, a significant control barrier involves filtration. The cost per analysis from testing laboratories may exceed $200 and require 2–14 days to complete. In contrast, dozens of samples can be run per day by a single, moderately trained nonspecialist with the Thermo Scientific Nicolet iN5 FTIR microscope (Figure 1) (Thermo Fisher Scientific, Madison, WI), resulting in a cost-effective and timely solution for the analysis of filters and other particulates.
This article covers the analysis of residues on a liquid filter, particulates on a chip bag, and dark material from cornmeal. A major advantage to infrared spectroscopy is that no sample preparation was needed for any of these, and each analysis required only minutes.
Experimental
A Nicolet iN5 FTIR microscope attached to a Nicolet iS10 FTIR spectrometer (Figure 1) was used for the analysis. The samples were placed on a glass slide, in most cases using double-sided tape to hold them flat. Spectra were collected using the germanium-tip ATR device. Visual illumination using the bright internal LED of the Nicolet iN5 microscope and on-board camera provided large-area targeting images. This, plus intuitive manual controls, enabled rapid movement to the point of collection. A round aperture was inserted to target the beam. Aperture size (1 mm), optics magnification (10×), and extra magnification due to the Ge crystal of the ATR (4×) yielded a 25-μm aperture at the sample. The high throughput of the Nicolet iN5 system coupled to the Nicolet iS10 spectrometer means that 1-minute measurements at 8-wavenumber resolution provide very good signal-to-noise results.
The target area was centered in the crosshairs, and the aperture and Ge-ATR were inserted. Background was collected with the ATR inserted but not in contact with the sample. The preview data collect option in the Thermo Scientific OMNIC software was enabled, and the stage was slowly raised to bring the sample into contact with the ATR. Contact was sufficient when indicated by the appearance of the spectra, often at much lower pressures than required to trigger the LED pressure indicators. Excessive pressure could actually penetrate the soft filters, so the preview mode was critical to successful data collection. The data were then collected at 8-cm-1 resolution. Spectra were then searched against databases using the OMNIC search function.
Results
The first sample analyzed was a filter used to clean milk during production. Figure 2 shows a spectrum of the clean filter, which indicates this is a vinyl acetate material. This is important as many of the residues also exhibited an ester peak (around 1750 cm-1), which is prominent in the filter spectrum.
 Figure 2 – Spectrum of the clean filter, which indicates this is a vinyl acetate material.
Figure 3 is from a region of the filter that was in the flow, but not showing a specific particulate. The entire filter was covered with a white residue, which this spectrum identifies as a fatty acid. This material could be analyzed in two ways—either with the ATR in contact with the filter and then subtracting the clean filter spectrum (Figure 2) or by pressing the ATR down, then lifting it up and analyzing the residue left on the ATR tip itself. The latter is shown in Figure 4—a significantly cleaner spectrum as no filter background is present and the match result is correspondingly very high.
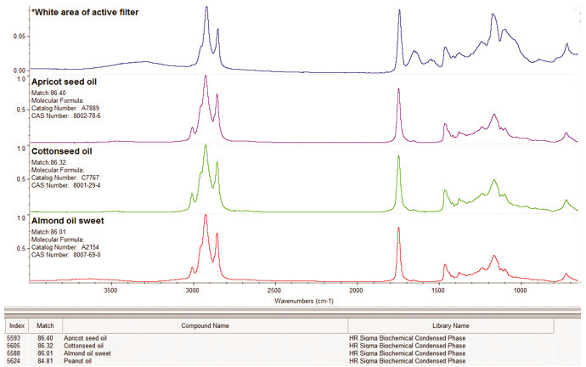 Figure 3 – White material on the filter is a fatty acid (triglyceride).
 Figure 4 – Analysis of the white residue on the ATR tip.
The ATR spectrum of a dark spot on the filter is shown in Figure 5, along with a video image. Subtraction of the spectrum from Figure 3 (filter background plus the white residue) leaves a spectrum showing a strong amide presence (the amide I and amide II bands are seen between 1500 and 1700 cm-1) plus other signals over the range 1000–1500 cm-1 indicative of sugars and possibly phosphates, all of which are typical of proteinaceous materials. Milk contains significant amounts of protein such as betalactoglobulin, a fat-transport protein. These materials can aggregate under the processing conditions, leading to sticky masses of material on the filter.
 Figure 5 – Dark particle contains fatty acid and amide material.
Figures 6–9 show spectra collected from the inside of a snack food bag. Figures 6 and 7 were acquired in reflectance mode (no ATR was used), which was possible because the bag was highly reflective. Again, spectral subtraction was used to remove the background signals due to the bag itself (predominantly polypropylene), allowing the droplet to be identified as an edible oil. The solid brown particle shown in Figure 8 was analyzed using ATR. Subtraction of the spectrum from the greasy coating on the bag yielded a spectrum dominated by a carbohydrate peak. When searched against a common materials library, this spectrum matched that of dried potato, a remarkably direct conclusion.
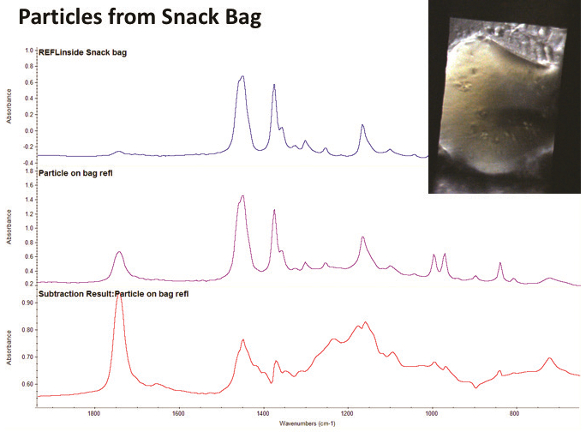 Figure 6 – Particles from snack bag.
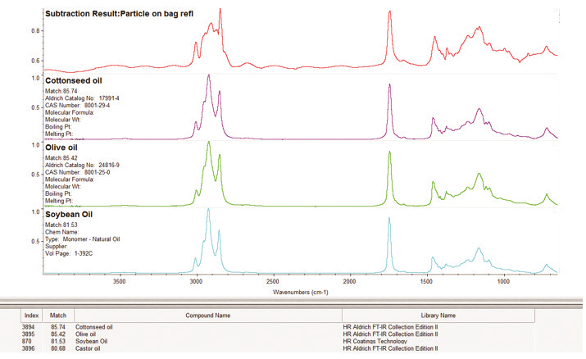 Figure 7 – Subtraction results: Particle on bag.
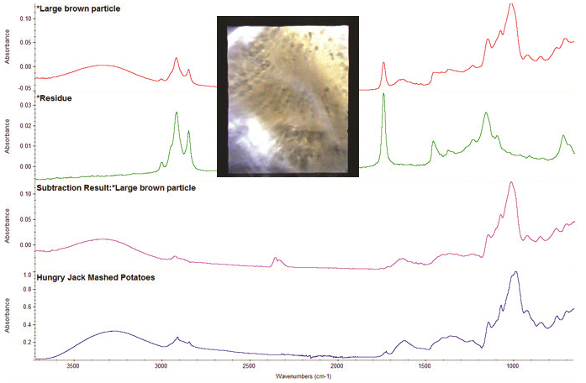 Figure 8 – Ge ATR.
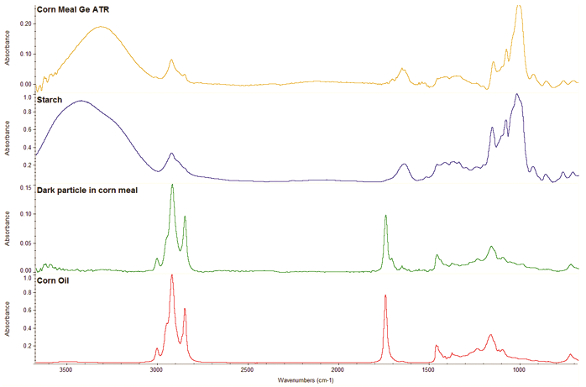 Figure 9 – Cornmeal Ge ATR.
Cornmeal often exhibits dark granules among the yellow-colored majority. An analysis of a yellow and dark granule is shown in Figure 9. The yellow granule matches starch, the majority constituent in cornmeal. The darker granule is quite different and appears to be corn oil. This is probably caused by overprocessing of a certain part of the sample, and is an example of an acceptable variation in a food product.
Figure 10 shows the spectrum of a fly wing, an undesirable contamination. Like most proteins, the spectrum is dominated by the amide bands, seen between 1300 and 1700 cm-1. Since all proteins exhibit these bands, careful analysis is required to determine the origin of the material. In this case, the image is a strong clue that the material is a foreign substance. The Nicolet iN5 microscope provides both visual and spectroscopic data to aid in identifications of this type.
 Figure 10 – Fly wing on NaCl plate.
Conclusion
Food safety and quality control require continuous monitoring. The importance of combining visual and spectroscopic data is demonstrated. In this example, filters were used as the sample, but extraction of particulates from a bulk sample is also a standard analytical procedure. With a well-designed library, the system provides an immediate feedback tool for quality control and diagnostics. The Nicolet iN5 FTIR microscope, combining visual and spectroscopic tools in a cost-effective, simple-to-use package, can drive improvements in quality, regulatory compliance, and cost savings.
Michael Bradley is senior manager, product applications, and Steve Lowry is research scientist, Thermo Fisher Scientific, 525 Verona Rd., Madison, WI 53711, U.S.A.; tel.: 608-276-6100; e-mail: [email protected]; www.thermofisher.com