Featured Article
Many continuous processes require frequent sample extractions and off-line analyses to optimize methods and monitor processes. The PDRSeparations (Palm Beach Gardens, FL) Concentration Monitor (CM) “looks inside” flowing streams and plots the real-time concentration for each UV-absorbing molecule in the flow. This reduces or eliminates the need for sample extractions and off-line analyses, and enables real-time monitoring and control. The system’s spectral deconvolution algorithm uses differences in absorption spectra (spectral fingerprints) to deconvolve completely overlapped components. Applications include simulated moving bed (SMB) chromatography and biopharmaceutical and chemical processing.
 Figure 1 – Concentration Monitor block diagram.
Figure 1 shows an inline fiber-optic flow cell, light source, spectrometer, and PC running proprietary PDR software. Hardware is small, compact, and robust, and includes an inline fiber-optic diode array detector and flow cell family for small- and large-diameter tubings (FiberDAD). Flow cells connect with fiber-optic cables, and thus are safe in explosive environments. Software includes proprietary spectral deconvolution and linearity compensation algorithms as well as various management and control functions. PDR software is written in Java and shows a continuously scrolling 3-D plot of all wavelengths in real time and selected real-time 2-D plots of deconvolutions.
Typically, an analytical separation method is developed on a standard HPLC with a diode array detector wherein all components are fully separated or each pure component is injected separately, as in the example here. In Figures 2 and 3, a customer used an Agilent (Palo Alto, CA) 1100 HPLC. Agilent 3-D data files were exported and then imported to PDR software where the spectral signature of each component was extracted for reference and saved as part of a spectral set. Figures 2 and 3 show raw 3-D plots of caffeine and biphenyl in the main plot window.
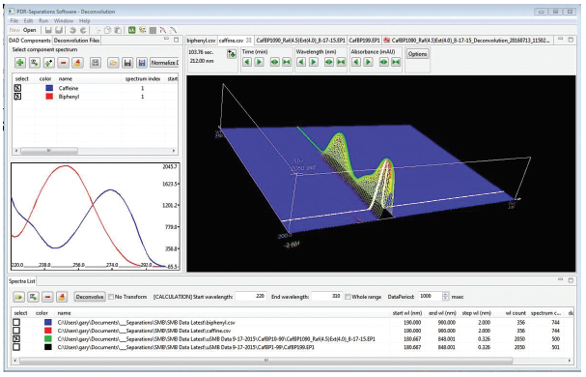 Figure 2 – HPLC data, caffeine spectra.
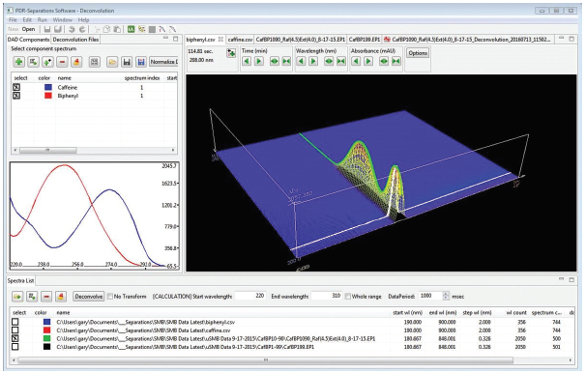 Figure 3 – HPLC data, biphenyl spectra.
The left plot window shows both spectra— caffeine in blue and biphenyl in red—a spectral set. There is a noticeable difference in these spectra, and this is the basis of the deconvolution. Using a spectral set, PDR software deconvolves raw data in real time and plots each component separately, even when completely overlapped. To improve accuracy at high absorbance values, the software also corrects for the inherent nonlinearity of absorbance detectors. Only two components are shown here, but the software is not limited as to the number of components that can be deconvolved.
Figures 4 and 5 show data from a Novasep (Boothwyn, PA) Micro SMB system using five pumps (raffinate, extract, feed, eluent, and recycle) and six SMB 70–20 columns (10 mm i.d. × 100 mm long, 20-µm particles, Fuji Silysia, Greenville, NC) connected in 1:2:2:1 zone configuration. Initial conditions were generated from Novasep Help software and refined with CM. Mobile phase was 75/25 (v/v) acetonitrile/methanol. A continuous chromatography process such as SMB improves chromatography process performance in terms of productivity, solvent consumption, and product concentrations. However, the effort required for method optimization and process monitoring often limits the technique to commercial-scale chiral separations. CM provides a fast way to optimize and run SMB in achiral separations; similar improvements result when using it in biopharmaceutical process applications.
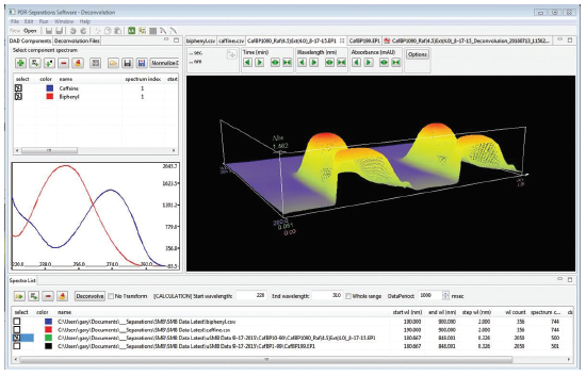 Figure 4 – SMB data, caffeine/biphenyl 10%/90%, raw data.
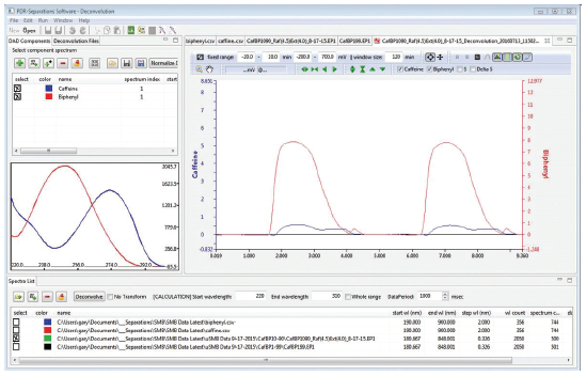 Figure 5 – SMB data, caffeine/biphenyl 10%/90%, deconvolved data
Figure 4 depicts real-time raw 3-D SMB data in the main window, and Figure 5 shows separate concentration profiles deconvolved for each component in real time, even with complete overlap.
Performance
Theoretical limits are primarily affected by signal-to-noise ratio (SNR) and uniqueness of spectral signatures. In practice, SNR is seldom an issue because concentrations are typically high, and the authors have not encountered lack of uniqueness in spectral signatures. PDR software includes a correlation matrix that predicts deconvolution quality. In this mathematical matrix, the ideal circumstance is for reference spectra (fingerprints) to be completely perpendicular with transformed correlation matrix values of 1.000/0.000. For the caffeine/biphenyl 10%/90% example, the transformed correlation matrix values are 1.000/0.096, very close to ideal. In practice, perpendicularity has not been a problem because the spectra of each component have been sufficiently different (perpendicular) to produce good accuracy and sensitivity. There is benefit to excluding wavelengths wherein normalized spectral differences are near zero, and PDR software includes this capability.
In real-world cases at sites running SMB, the system accurately displayed concentration for 2- and 3-component flows, even when one component’s concentration was only 1%. These are not limiting values, just the requirements of jobs. CM can deconvolve a large number of components, including those with low concentrations.
Summary and conclusion
Three problems were evident at the outset: flow cells, linearity, and deconvolution. Because most applications use high concentrations, flow cell pathlengths needed to be less than 0.5 mm to avoid excessive absorbance effects. For larger-diameter tubings, thin optical probes were developed that can be inserted perpendicular to flow and adjusted to almost touch, creating a short pathlength. A linearity compensation algorithm improves accuracy across a large absorbance range, and a deconvolution algorithm extracts individual concentrations. The biggest challenge in algorithm development was the requirement to operate in real time. Deconvolution algorithms such as primary component analysis (PCA) and exploratory factor analysis (EFA) were tried, but none performed well in real time. To overcome this challenge, PDR developed algorithms, flow cell optical probes, and flow cells that are robust and bioinert, and can be cleaned in place.
This new capability is expected to further improve the benefits of continuous processing and analysis by reducing or eliminating the need for sample extractions and off-line analyses. Real-time information makes optimization quick and intuitive. Continuous real-time monitoring can be used to great advantage in fully automated operations, reducing labor, increasing productivity, and alleviating operational uncertainties.
Gary W. Yanik is president; Necmi Bugdayci is in Mathematics; and Soydan Kavraal is in Programming, PDR-Separations, 3 Old Meadow Way, Palm Beach Gardens, FL 33418, U.S.A.; tel.: 561-818-8445; e-mail: gwyanik@pdr-separations. com; www.pdr-separations.com. Necmi Bugdayci developed algorithms, and Soydan Kavraal wrote Java code.