Featured Article
Please check out our Spectrophotometer section to find manufacturers that sell these products
Spectrophotometers measure the amount of light of a specific wavelength that is absorbed by a sample. A spectrophotometer is used chiefly to measure the concentration of analytes in solutions, but is also used to characterize liquid and solid samples. The simplest spectrophotometers send a single wavelength beam through a single sample, measure the intensity of the beam to determine the absorbance, and then display the result.
At their most complex, spectrophotometers use scanning dual beams to measure the absorbance of multiple samples at multiple wavelengths from ultraviolet (UV) to the infrared (IR), and then present the results in sophisticated software.
Spectrophotometers are very widely used and have a range of applications across different industry sectors, including pharmaceutical, biologics, environmental, chemical, food, and materials manufacturing.
Types of spectrophotometers
Spectrophotometers are broadly categorized by:
- Wavelength range: UV/VIS, VIS, NIR, UV/VIS/NIR
- Beam configuration: single-beam or double-beam.
Wavelength range
Spectrophotometers cover a range of wavelengths from the ultraviolet through the visible spectrum, and into the infrared (see Table 1). The choice of wavelength range will depend on the application for which the instrument is required.
Table 1 – Spectrophotometer wavelength range

UV/VIS spectrophotometers are the most widely used. Visible spectrophotometers are a less expensive option if your applications are colorimetric.
When equipped with a two-detector integrating sphere, the UV-2600 spectrophotometer (Shimadzu Scientific Instruments, Columbia, MD; www.ssi.shimadzu.com) features a measurement wavelength range to 1400 nm. This range permits measurements in the near-infrared region, and expanded research of photovoltaics and other materials.
The DU® Series 700 spectrophotometer from Beckman Coulter (Brea, CA; www.beckmancoulter.com) has a wavelength range of 190–1100 nm, taking it from the UV to the edge of the near-infrared (NIR).
Some spectrophotometers cover the entire UV/VIS/NIR spectrum. The Cary 5000 from Agilent Technologies (Santa Clara, CA; www.chem.agilent.com) has a photometric performance from 175 to 3300 nm.
FTIR is used to determine the composition of mixtures of chemicals and is more accurate than IR. It involves the transmission of a spectrum of frequencies, rather than a single wavelength. Computational Fourier transform analysis is used to produce the resultant spectra.
Beam configuration
Spectrophotometers can be single-beam or double-beam. Double-beam spectrophotometers are more expensive but have higher stability and better baseline flatness. They are also quicker to use since the reference is measured at the same time as the sample.
- Single-beam: One sample is measured at a time. Single-beam is the simplest and least expensive option.
- Double-beam: The beam is split into two. One beam passes through the sample; the other passes through the reference sample. This removes the need for a separate reference measurement and also gives continuous feedback on variations in the light source, providing a high level of accuracy.
Spectrophotometer technology
Spectrophotometers consist of the following main components:
- Light source: Emits light in the UV, VIS, or IR range
- Filter: Filters the light to the required wavelength for the assay
- Sample holder: Used for one or many samples
- Photometric detector: Measures the intensity of the light after it has passed through the sample
- Interface: Anything from a simple digital readout to sophisticated analysis and visualization software.
Light source
The main light sources are:
- Deuterium: Optimum in UV (190–370 nm)
- Tungsten halogen: Optimum for VIS (320–1100 nm)
- Xenon flash lamps: UV/VIS (190–1100 nm)
- LED (light-emitting diode): Stable across the spectrum.
When choosing a light source, the main factors to consider are wavelength and lamp life. Deuterium lamps typically have a lifetime of 100 hr, while tungsten halogen and xenon lamps can be expected to last for 3000 hr. PerkinElmer (Waltham, MA; www.perkinelmer.com) equates this to a typical lab lifetime of five years for the xenon light source in the LAMBDA™ XLS. LEDs can have an extremely long lifetime of over 100,000 hr.
Filter
A monochromator splits the light into different wavelengths using either a prism or a diffraction grating. The required wavelength is typically selected using a narrow slit. Spectrophotometers with double monochromators provide the highest stability, sensitivity, and accuracy, but the high cost of maintenance often overshadows their use in the vast majority of UV/VIS measurements.
Sample holder
Check that the size of the sample compartment is adequate for the expected sample size and that there is a suitable range of accessories for your application.
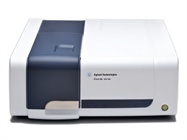
The wide choice of accessories for the Cary 60 UV-VIS spectrophotometer from Agilent Technologies allows for a wide range of solid and liquid sample sizes and types. Liquid sampling accessories include fiber optic probes and couplers, Peltier and water thermostated single and multicell holders, temperature probes, microvolume sampling cells, and a rapid mix accessory for stopped flow kinetics (see Figure 1).
Photometric detector

Figure 1 – Cary 60 UV-VIS spectrophotometer from Agilent.
Most spectrophotometers use silicon diodes as detectors. For the ultimate in sensitivity and precision, opt for expensive photomultiplier detection systems.
Biochrom (Cambridge, U.K.; www.biochrom.co.uk) notes that spectrophotometers using a split-beam configuration and diode array detection do not need a lid to protect the ingress of light into the sample chamber. This is a particularly useful feature when measuring samples in test tubes.
Interface
Interfaces range from simple LED displays to touchscreen interfaces with preprogrammed spectroscopy methods to PC outputs with sophisticated data analysis software. Many instruments can be preprogrammed for particular applications such as kinetics, color determinations, and water analyses.
The DR 6000™ UV/VIS spectrophotometer from Hach (Loveland, CO; www. hach.com) comes preprogrammed with over 240 methods, including surfactants and nutrient parameters.
The LAMBDA 750 from PerkinElmer uses UV WinLab software, which includes spectral processing data and application-specific software modules.
By contrast, Series 1000 spectrophotometers from Cecil Instruments (Cambridge, U.K.; www.cecilinstruments.com) are designed for ease of use at a low cost. They feature only six programmed operating keys and are popular with universities and other educational establishments.
Spectrophotometer performance specifications
There are a number of specifications relevant to spectrophotometers that are useful in evaluating the performance of an instrument, including: spectral bandwidth, scanning, photometric noise, stray light, and baseline drift and flatness.
Spectral bandwidth
The spectral bandwidth is a measure of the distribution of wavelengths of light that are directed at the sample. A narrower bandwidth results in better resolution, but also decreases the signal-to-noise ratio.
Most instruments have a fixed spectral bandwidth at 1.0 nm, while others have a variable range. The spectra of vapor or gases require narrow bandwidths down to 0.5 nm for good structural resolution.
The T80 from PG Instruments (Leicester, U.K.; www.pginstruments.com) is a high-performance double-beam spectrophotometer available with a fixed (2 nm) or variable (0.5, 1, 2, 5 nm) spectral bandwidth. The T92+ features a continuous slit from 0.1 to 5.0 nm at 0.1-nm intervals.
Scanning
Scanning spectrophotometers scan through a range of wavelengths and record the absorbance levels at each wavelength. Check whether the instrument has a preset scanning speed or whether you can choose the speed depending on your requirements. Aquarius spectrophotometers from Cecil Instruments have a variable scan rate of 1–4000 nm/min (see Figure 2) and include PC connectivity via USB ports.
Photometric noise

Figure 2 – Aquarius double-beam spectrophotometer from Cecil Instruments.
Low noise results in high sensitivity, which can enable faster scan times or more accurate results.
Stray light
The lower the stray light, the better the photometric accuracy, especially at higher absorbance levels.
Utilizing proprietary diffraction gratings, Shimadzu’s UV-2700 achieves ultralow stray light of 0.00005 %T at 220 nm, expanding its photometric performance range to 8 Abs. This eliminates the need to dilute samples and allows the measurement of low transmittance samples.
Baseline drift and flatness
Baseline drift should be as low as possible so that less time is required for the zeroing of baselines during an experimental session. Factors such as shielding from the ambient temperature fluctuations and drafts will improve the baseline drift.
Baseline flatness should be as low as possible over the complete wavelength range to help provide for high measurement accuracy.
Check how long it takes for the instrument to warm up, and how frequently calibration tests should be performed.
Recent developments in spectrophotometers
Recent advances have been made in the nature, availability, and flexibility of propriety nano cells for ultramicro-volume samples such as nucleic acids and proteins.
The Genova Nano micro-volume spectrophotometer from Jenway (Bibby Scientific, Burlington, NJ; www.bibby-scientificusa.com) detects DNA concentrations as low as 2 ng/μL and only requires a sample volume of 0.5 μL.
Beckman Coulter supplies 50-μL microcells that can be used with a specifically designed cell holder that allows for the recovery of DNA, RNA, or oligonucleotide samples.
A list of spectrophotometer manufacturers is given in Table 2.
Table 2 – Manufacturers of spectrophotometers
| Agilent Technologies | Santa Clara, CA | www.chem.agilent.com |
| Biochrom | Cambridge, U.K. | www.biochrom.co.uk |
| Beckman Coulter | Brea, CA | www.beckmancoulter.com |
| Cecil Instruments | Cambridge, U.K. | www.cecilinstruments.com |
| Hach | Loveland, CO | www.hach.com |
| Jenway (Bibby Scientific) | Burlington, NJ | www.bibby-scientificusa.com |
| OLIS | Bogart, GA | www.olisweb.com |
| PerkinElmer | Waltham, MA | www.perkinelmer.com |
| PG Instruments | Leicester, U.K. | www.pginstruments.com |
Shimadzu Scientific Instruments
| Columbia, MD | www.ssi.shimadzu.com |
| Thermo Fisher Scientific | Madison, WI | www.thermoscientific.com |
Katriona Scoffin, B.Sc., is a freelance science writer; e-mail: [email protected].
Please check out our Spectrophotometer section to find manufacturers that sell these products