Featured Article
Differential scanning calorimetry (DSC) is a powerful tool used to obtain information from materials based on the response to change in temperature, including phase changes and various kinetic events. The technique is often used to characterize and compare polymers both as a means of determining initial processing parameters and as a diagnostic tool for identifying certain processing problems. One common problem in polymer processing is variations in cycle time between plastics that are known to have the same composition and formulation. The addition of color concentrates, fillers, additives and other plastics can affect cycle times and end-use properties. When variations in processing behavior are observed, often an initial investigation is a compositional analysis that may or may not yield an explanation and is costly and time consuming. A simple DSC experiment can demonstrate significant potential processing differences between what are believed to be similar materials.
In addition to a comparison of thermal events, another way to obtain more information from the DSC experiment is to analyze the crystallization (cooling) data using the Avrami macro kinetic model. This experiment is done at a constant cooling rate, so it is nonisothermal, but the data generated can be easily converted to a time scale. This provides a useful comparison of crystallization half-time, rate constant and geometric exponent in addition to the crystallization temperature (TC), and is an effective way to compare two or more samples to determine if there is a need for more extensive kinetic study. From a practical standpoint, it can be used to verify analytically that there are differences between “good” and “bad” samples. Essentially, this is a single-point dynamic or nonisothermal crystallization experiment; basic definitions are given below.
Isothermal crystallization experiment
Isothermal crystallization studies of plastics and other materials by DSC have been extensively utilized and documented in the literature, and many use the Avrami equation to fit the crystallization data. In the isothermal crystallization DSC experiment, the fraction crystallized as a function of time can be expressed by Eq. (1):

where:
X(t) is fraction crystallized at time (t)
ΔHC is overall enthalpy of crystallization
ΔHt is enthalpy crystallized at extent of conversion
dHC is enthalpy of crystallization during infinitesimal time range (dt)
t0 is time at initial crystallization
t is times during crystallization
t∞ is time when crystallization process is complete.
The function of crystallized fraction X(t) can be fitted using Eq. (2), the Avrami equation:

where:
X(t) is fraction crystallized at time (t)
ka is Avrami rate constant
na is Avrami exponent
t is time.
The linear form of the Avrami equation is shown in Eq. (3):

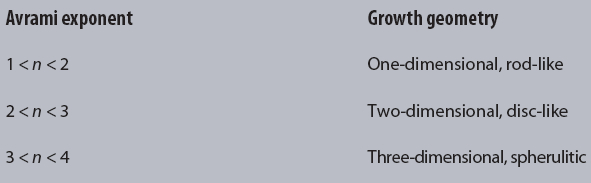
A plot of the log (–ln(1 – X(t)) versus log t is linear and yields the Avrami parameters ka (antilog of intercept) and na (slope). The Avrami exponent correlates with the nucleation growth geometry and is summarized in Table 1.
Table 1 – Simplified Avrami exponent interpretation
Single-point nonisothermal crystallization experiment
The Avrami equation is also used in nonisothermal crystallization studies. Contrasted with the isothermal method, nonisothermal crystallization data is obtained by heating or cooling the sample at a cooling rate instead of isothermally. In this simple form of the experiment, a single DSC heating rate is utilized, and the Avrami parameters ka and na, Avrami rate constant and nucleation exponent are compared. An analogous expression for Eq. (1) is shown in Eq. (4) for fraction crystallized as a function of temperature:
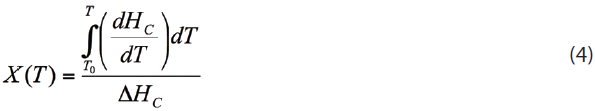
where:
X(T) is fraction crystallized at temperature T
ΔHC is overall heat of crystallization
dHC/dT is enthalpy of crystallization during infinitesimal temperature range dT
T0 is temperature at initial crystallization
T is temperature during crystallization
T∞ is temperature when crystallization is complete.
Eq. (4) can be related to Eq. (1) by using Eq. (5) to convert the temperature-dependent data to time-dependent data and fit using the Avrami equation:
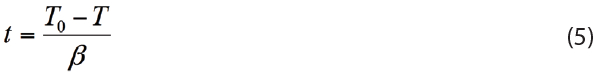
where:
t is time
T0 is temperature at crystallization onset
T is temperature during crystallization process
β is cooling rate (°C/min).
For this experiment, t0 is obtained by defining it at some point of conversion—arbitrarily 1% or X(t) = 0.01 (Eq. [1]). Once t0 is established, the linear form of the Avrami equation (Eq. [3]) is utilized to plot log(–ln(1 – X(t)) versus log t. Eq. [3] is a linear equation of the form of y = mx + b, but often the crystallization data is linear in a narrow range and different crystallization regimes are apparent. A good starting point is between the limits of X(t) = 0.2 and X(t) = 0.8. This will often yield a straight line of slope n and intercept log k. From the Avrami parameters, one can calculate t1/2 using Eq. [6] (also see Figure 1):
 Figure 1 – Example of Avrami analysis using linear form from
 X
(t
) = 0.2 to X
(t
) = 0.8.Experimental
Samples
Samples used were marker pen caps in various colors purchased from a local office supplier. (They are polypropylene but the author does not have access to the formulation; the base resin is likely the same formulation.) Sample colors include black, red, yellow, brown, orange, green, blue and purple. A cap made from polypropylene containing no pigments was used as a reference.
Instrument and experimental parameters
- Instrument: Discovery DSC 2500 (TA Instruments, New Castle, Del.)
- Sample mass: 5 mg nominal
- Purge gas: N2 at 50 mL/min
- Temperature and heat flow calibration: indium and sapphire standards
- Method: Samples were heated to 235 °C and subsequently cooled at 10 °C/min to 0 °C.
Results and discussion
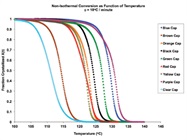
Figure 2 shows an overlay of nonisothermal crystallization exotherms. It is obvious that the different-colored caps yield a substantially different array of exotherms of various shapes, symmetries and crystallization temperatures. The fraction crystallized as a function of temperature, generated from Eq. (4), is shown in Figure 3. Figure 4 depicts the fraction crystallized after converting to time domain (Eq. [6]) and applying Eq. [1]. It is apparent that the sample with the highest crystallization temperature is not necessarily the fastest to crystallize.
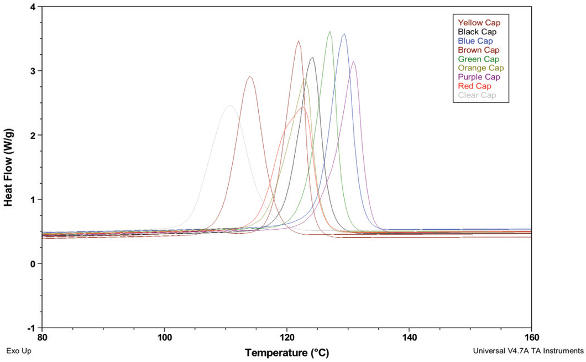 Figure 2 – Crystallization exotherms for cap samples.
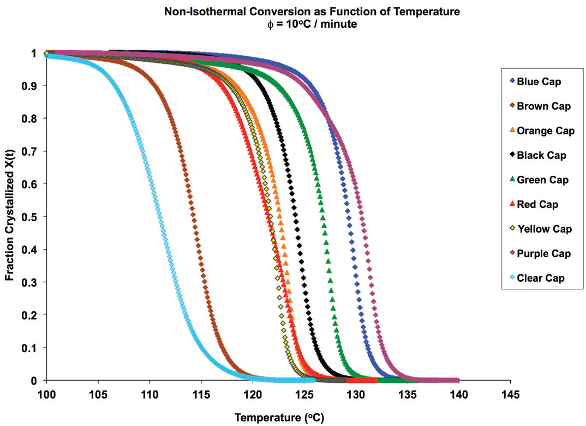 Figure 3 – Crystallized fraction as a function of temperature.
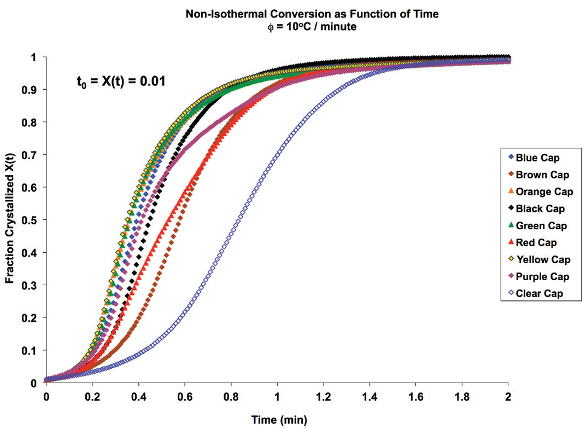 Figure 4 – Fraction crystallized as a function of time.
The single-point Avrami analysis is summarized in Table 2 and Figure 5. Each color sample and the unpigmented reference show different crystallization characteristics. The Avrami exponent n is related to the nucleation geometry. It does not hold the same meaning as in the isothermal experiment, but can be used empirically to compare similar samples. The different values for n observed in the samples indicate that the materials crystallize differently and may have different physical properties. Each of the samples has a rate constant k that is substantially higher than the sample with no colorant.
Table 2 – Summary of single-point Avrami analysis
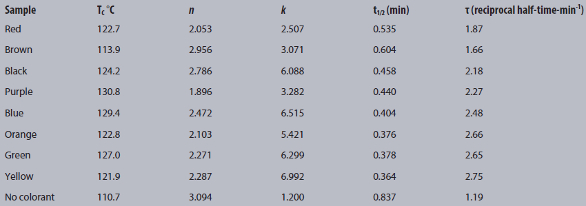
 Figure 5 – Avrami comparison of colored pen caps.
Conclusion
The samples analyzed in this experiment yield varying Avrami parameters and will likely process differently. For polypropylene parts, the effect of additives on the crystallization performance can be compared empirically with a single-point Avrami analysis.
Additional reading
- Hongfang Zhang, H.; Mo, Z. et al. Polym. Testing 2005, 24, 873–85.
- Supaphol, J. Appl.Polym. Sci. 2000, 78, 338.
- Supaphol, J.; Thanomkiat, P. et al. Polym. Testing 2004, 23, 881.
Read the full article at http://www.tainstruments.com/pdf/literature/TA393.pdf.
James A. Browne is senior applications scientist, TA Instruments, 159 Lukens Dr., New Castle, Del. 19720, U.S.A.; tel.: 302-427-4000; www.tainstruments.com