Featured Article
During 2009, law enforcement agencies reported 58,871 arsons to the Federal Bureau of Investigation, at an estimated total direct cost of $10.3 billion in property damage. One out of every four fires is due to arson. The National Fire Protection Association estimates that approximately 300–350 civilian deaths per year and 5.6 firefighter injuries per 100 structure fires are due to arson.
Arson investigators usually begin by looking at the three factors, known as the fire triangle, that must be present in order to create and sustain a fire:1 a flammable substance, a starting heat source and oxygen. The starting heat source needs to match the ignition temperature of the flammable substance. To classify a fire as arson, the investigator must prove tampering with at least one of the factors in the fire triangle.
The arsonist will alter the environment to intentionally tamper with one or more of these three factors. It is common practice to use flammable materials and accelerants such as kerosene, diesel fuel or gasoline.
Debris from suspected arson fires is routinely analyzed for trace amounts of hydrocarbon accelerants. Samples of debris are usually sealed at the fire scene, in an airtight container—typically a new unlined metal paint can. The samples are then brought to the lab for analysis. Analysis is conducted in three stages: 1) concentration and extraction of the suspected accelerants from the fire debris matrix, 2) instrumental analysis of the concentrated extracted samples and 3) interpretation and analysis of results.2
Much research has focused on the first stage. Steam distillation3 and solvent extraction4 were the first methods used in the extraction and concentration of the suspected accelerants from debris.5 Distillation of debris samples using steam or high-boiling-point solvents, i.e., ethylene glycol, produces a floating layer on top of the distillate that can be used in the second stage of the investigation.6 This is a labor-intensive process that can take 48 hours or more to complete. Further, the distillation rate may influence the extraction.7 Solvent extraction is fast, but undesirable components may be extracted from the matrices that interfere with analysis.
Forensic investigators have searched for better methods with which to separate and concentrate the accelerants from fire debris. These include sampling by direct,8 dynamic9 or passive headspace with activated charcoal or solid-phase microextraction.10,11 Direct headspace sampling extracts the volatile components in the gas portion above the sample. This method proved to be less sensitive and was only useful in the detection of highly volatile accelerants, i.e., alcohol and lacquer thinners. Dynamic headspace involves a flow of inert gas through the sample vessel. The volatile accelerants are collected into a trap made of material like charcoal. Desorption into the analyzing instrument can be done by stripping solvents or heating.
In 1985 Dietz introduced passive headspace with activated charcoal strips.12,13 Charcoal strips trap and concentrate the volatiles in the headspace above the sample. A solvent, i.e., carbon disulfide, n-pentane, desorbs the volatiles absorbed by the strips.14,15 This is a very sensitive method that can concentrate and isolate small quantities of accelerants from fire debris.
Solid-phase microextraction selectively concentrates fire debris volatiles into an absorbent fiber. This method is also very sensitive, and no solvent is used.16,17
Forensic investigators have used GC/FID (flame ionization detection),14,15,18 GC/MS,19,20 GC/MS/MS,21 FT/ICR (Fourier transform-ion cyclotron resonance)22 and GC×GC.23–25 The current investigation showed that two-dimensional gas chromatography-quadrupole mass spectrometry (GC×GC-MSq) is a powerful tool for this type of complex arson analysis.
Experimental
The GC/MS system used was a Shimadzu QP 2010 Ultra (Shimadzu Scientific Instruments, Inc., Columbia, Md.). This is a gas chromatograph-quadrupole platform; as a general rule, quadrupole mass spectrometers have a relatively slow scan speed, which has become a limiting factor for quadrupoles in comprehensive GC×GC/MS. The maximum allowable data acquisition speeds have been 30 Hz—too slow to provide enough points for the ultrasharp peaks generated by comprehensive GC×GC. However, this instrument is equipped with Advanced Scanning Speed Protocol firmware and a fast data collection algorithm, which allows it to collect data at 100 Hz.
A two-stage thermal loop modulator (Zoex Corp. Lincoln, Neb.) was mounted on top of the GC oven to provide comprehensive 2-D GC capabilities. This system employs a cold gas jet and a hot gas jet. The single cold jet cools two different segments of the second column, entrapping the compounds in the two sections of the second column, while the hot jet, positioned perpendicular to the cold jet, releases the entrapped compounds.26
Table 1 shows GC experimental parameters and columns. The first column was a high-polarity phase and the second was nonpolar. Separation was via polar-by-volatile interaction with the samples. The samples were thus separated by polarity in the X-axis and by boiling point Y-axis retention times.
Table 1 – GC experimental parameters
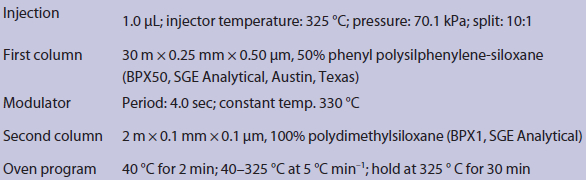
MS data was collected with Shimadzu, GC/MS Real Time Analysis software, and GC×GC/MS data was analyzed using GC Image V 2.1 software (Zoex Corp.).
Sample preparation
Gasoline, kerosene and diesel samples (0.09 g) were diluted into 10 mL of methylene chloride. “Arson” samples were prepared by solvent extraction with methylene chloride. The investigators intentionally selected solvent extraction. As previously stated, this sample extraction and concentration technique is sensitive but troublesome. The solvent can extract undesirable compounds from the matrix that can interfere with the analysis.
Results and discussion
Comprehensive GC×GC works on the principles established by Phillips.27–29 It involves separation by two orthogonal GC columns. The sample is separated into fractions and each fraction is transferred and cryogenically focused to a secondary column with different polarity than the first. Because the second separation is faster than the first, the first separation can be maintained. Thus, chemical compounds are separated by their independent chemical properties interacting with two orthogonal column phases.30–32 A polar column was chosen as the first column. Since the most polar compounds in the crude are aromatic, polyaromatic hydrocarbons and polyaromatic heterocycles, they are regularly spaced along the base of the 2-D GC×GC chromatogram, and appear in order of increasing polarity. First to elute are the mono-aromatic compounds followed by the two-ring, three-ring and heterocyclic aromatic compounds. The nonpolar paraffinic components have the weakest interaction with the first column, and the second nonpolar column separates them. They emerge according to their volatility, forming the top band in the 2-D GC×GC chromatogram. Between these two bands, compounds with intermediate polarity and volatility will reside, i.e., alkylated mono-aromatic and polyaromatic compounds.
To identify the sample components, a GC×GC was coupled to a quadrupole MS. Frysinger et al.33 coupled a quadrupole mass spectrometer to a GC×GC system, concluding that, due to the high resolution and narrow peaks generated by the GC×GC system, a faster scanning MS was required.
The quadrupole MS used by these authors scans at a rate of 100 Hz and thus meets the qualification necessary for coupling it to a GC×GC system. Mass spectral data was collected throughout the whole chromatographic runs of gasoline, kerosene, diesel and a suspected arson sample. The software identified peaks as “blobs,” a blob being a collection of the pixels making up each peak. Each blob contains information identifying the 2-D retention time and the mass spectra of the compound that makes up the collection of pixels. Further, the sum of the pixels’ value of each blob is proportional to the quantity of the compound that composes that blob. The software allowed selection of minimum area, volume and peak area for blob selection. Blob selection can also be performed by computer cursor selection of a specific blob. Total ion chromatograms (TICs) for the samples are shown in Figures 1–4.
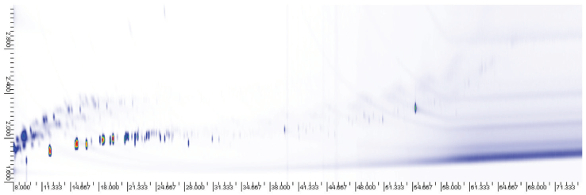 Figure 1 – Comprehensive GC×GC-qMS total ion chromatogram of gasoline.
 X
-axis: first dimension; retention time in seconds. Separation based on polarity. Y
-axis: second dimension; volatility-base separation in seconds.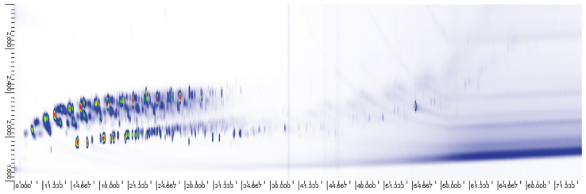 Figure 2 – Comprehensive GC×GC-qMS total ion chromatogram of kerosene.
 X
-axis: first dimension; retention time in seconds. Separation based on polarity. Y
-axis: second dimension; volatility-base separation in seconds. Figure 3 – Comprehensive GC×GC-qMS total ion chromatogram of diesel.
 X
-axis: first dimension; retention time in seconds. Separation based on polarity. Y
-axis: second dimension; volatility-base separation in seconds.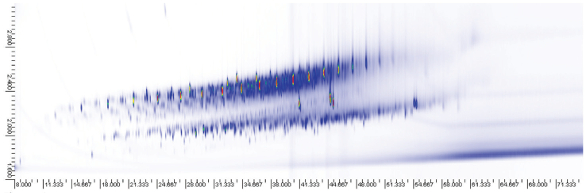 Figure 4 – Comprehensive GC×GC-qMS total ion chromatogram of suspected arson sample.
 X
-axis: first dimension; retention time in seconds. Separation based on polarity. Y
-axis: second dimension; volatility-base separation in seconds.TICs can generate chromatographic patterns that can be useful and deceptive at the same time. Pyrolysis of nonaccelerant matrices may generate chromatographic patterns that interfere with recognizing the accelerant’s distinctive fingerprint patterns. Individual compound identification is insignificant in an arson investigation—the overall fingerprint pattern recognition of the accelerant is used to confirm their presence. Fingerprint patterns of selective diagnostic ions associated with hydrocarbon accelerants can be used to screen and identify a particular accelerant. The diagnostic ions used are given in Table 2.
Table 2 – Characteristic ions for accelerant pattern identification25,34*
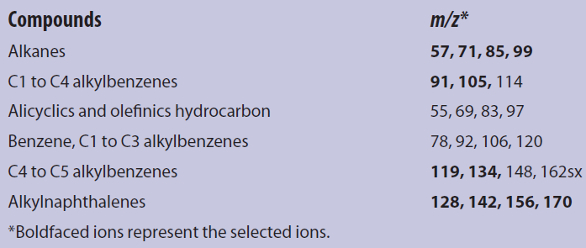
Alkanes (57, 71, 85, 99), alkylbenzenes (91, 105, 119, 134) and alkylnaphthalenes (128, 142, 156, 170) were used in this investigation. The selective ion chromatograms for these ion sets for gasoline, kerosene, diesel and the suspected arson sample (Figures 5 and 6) revealed the fingerprint pattern of an accelerant in the suspected arson sample. A fairly close match was observed between the diesel and the suspected arson sample. Slightly different were the light portions of the chromatographs. The low-boiling-point components of the accelerants are usually the first to be consumed by the fire. Therefore, it is possible to positively confirm the presence of accelerant (possibly diesel) in the suspected arson sample.
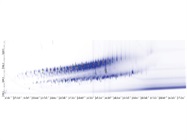
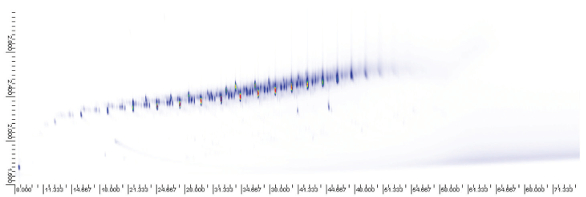 Figure 5 – Comprehensive GCXGC-qMS profile of selective alkanes ions for the suspected arson sample.
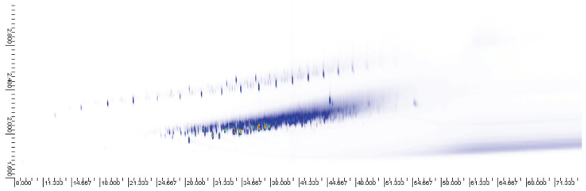 Figure 6 – Comprehensive GC×GC-qMS profile of elective alkylnapthalene ions for suspected arson sample.
Conclusion
Hydrocarbon accelerants and a suspected arson sample were analyzed by comprehensive GC×GC-MSq, which has the advantage of using two orthogonal GC columns. Because the first column was polar and the second was nonpolar, the detector used was a fast scanning quadrupole mass spectrometer. Selective ion monitoring allowed 2-D separation of samples. Using selective ion monitoring of selective target ions, fingerprint patterns can be generated that are useful for identifying accelerants in fire debris samples.
References
- Peige, J.D.; Laughlin, J.W. et al. Essential of Fire Fighting. Fire Protection Publication, Oklahoma, 1977.
- Stauffer, E. and Lentini, J. Forens. Sci Int. 2003, 32, 63–7.
- American Society for Testing and Materials, ASTM E 1385-00. Standard practice for separation and concentration of ignitable liquid residues from fire debris samples by steam distillation. Annual Book of ASTM Standards, 14.02, 2001, pp 413–14.
- American Society for Testing and Materials, ASTM E 1386-00. Standard practice for separation and concentration of ignitable liquid residues from fire debris by solvent extraction. Annual Book of ASTM Standards, 14.02, 2001, pp 415–16.
- Camp, M.J. Anal. Chem. 1980, 52(3), 422A–6A.
- Clodfelter, R.W. and Hueske, E.E. J. Forens. Sci. 1997, 22(1), 116–18.
- Armstrong, A.T. and Witlkower, R.S. J. Forens. Sci. 1978, 23(4),662–71.
- American Society for Testing and Materials, ASTM E 1388-00. Standard practice for sampling of headspace vapors from fire debris samples. Annual Book of ASTM Standards, 14.02, 2001, pp 425–6.
- American Society for Testing and Materials, ASTM E 1413-00. Standard practice for separation and concentration of dynamic headspace concentration. Annual Book of ASTM Standards, 14.02, 2001, pp 434–6.
- American Society for Testing and Materials, ASTM E 1412-00. Standard practice for separation of ignitable liquid residues from fire debris sample by passive headspace concentration with activated charcoal. Annual Book of ASTM Standards, 14.02, 2001, pp 431–3.
- American Society for Testing and Materials, ASTM E 2154-01. Standard practice for separation and concentration of ignitable liquid residues from fire debris samples by passive headspace concentration with solid phase microextraction (SPME). Annual Book of ASTM Standards, 14.02, 2002, p 897.
- Dietz, W.R. Evaluation of simple diffusion techniques for accelerant recovery. Presented at the Combined Meeting of Forensic Science Societies, Lexington, Ky., May 1985.
- Dietz, W.R. J. Forens. Sci. 1991, 36(2), 111–21.
- Newman, T.R.; Dietz, W.R. et al. J. Forens. Sci. 1996, 41(3), 361–70.
- Waters, L.V. and Palmer, L.A. J. Forens. Sci. 1993, 38(10), 165–83.
- Ahmad, U.K. and Selvaraju, G. Inter. J. Forens. Sci. 2007, 2(1), 1–16.
- Sandercock, P.M.L. and Du Pasquier, E. Forens. Sci. Int. 2003, 134(1), 1–10.
- Andrasko, J. J. Forens. Sci. 1983, 28(2), 330–4.
- Frontel, L.; Pozas, J.A. et al. Forens. Sci. Int. 1995, 75, 11–23.
- Mach, M.H. J. Forens. Sci. Soc. 1977, 22, 348–57.
- de Vos, B.-J.; Froneman, M. et al. J. Forens. Sci. 2002, 47(4), 736–56.
- Rodgers, R.P.; Blumer, E.N. et al. J. Forens. Sci. 2001, 46(2), 268–79.
- Frysinger, G.; Gaines, R. et al. Envir. Forens. 2002, 3(1), 27–34.
- Frysinger, G. and Gaines, R. J. Forens. Sci. 2002, 47(3), 471–82.
- Pert, A.D.; Baron, M.G. et al. J J. Forens. Sci. 2005, 51(5), 1033–48.
- Ledford, E.B.; TerMaat, J.R. et al. www.zoex.com
- Phillips, J.B. and Liu, Z. Chromatographic Technique and Apparatus. U.S. Patent No. 5,135,549; 1992.
- Phillips, J.B. and Liu, Z. Apparatus and Method for Multi-dimensional Chemical Separation. U.S. Patent No. 5,196,039; 1993.
- Phillips, J.B. and Xu, J. J. Chromatogr. A 1995, 703, 327–34.
- Ventrakanami, C.J.; Xu, J. et al. Anal. Chem. 1996, 68(9), 1486–92.
- Bertsch, W. J. High Resolut. Chromatogr. 1999, 2212, 647–65.
- Bertsch, W. J. High Resolut. Chromatogr. 2000, 23(3) 167–81.
- Frysinger, G.S. and Gaines, R.B. J. High Resolut. Chromatogr. 1999, 22(5), 251–5.
- www.leco.com/support/library
Clifford M. Taylor is with Shimadzu Scientific Instruments, Columbia, Md., U.S.A. A. Kirk Rosenhan is with Oktibbeha County Fire Services, Mississippi State, Miss., U.S.A. Jose M. Rodriguez (deceased) and Joey M. Raines are with Mississippi State Chemical Laboratory, Mississippi State, Miss., U.S.A.; tel.: 662-325-3324. Alex Mutin of Shimadzu Scientific Instruments provided the GC/MS, and Edward Ledford of Zoex Corp. (Houston, Texas) provided the modulator and software. Accelerant samples were obtained from Mississippi State Chemical Laboratory, and fire debris samples were from Oktibbeha County Fire Services.