Featured Article
Traditional gemstone analysis methods include the scratch test, UV light test, fog test, conductivity test, loupe test, transparency test, heat test, and density test. The scratch test and the heat test must be done carefully, as they can damage gemstones; nondestructive analysis can be done using the conductivity test and optical methods such as the UV light test and refractive index test, and methods that detect color changes between natural light, incandescent light, and fluorescent light. Refractive index (RI) testing is useful for distinguishing between natural and synthetic sapphires. A refractometer can measure the RI of a transparent stone to determine the degree of light-path divergence within an optically transparent stone. Each optically transparent gemstone has its own RI value, which indicates quality. Ultraviolet-induced fluorescence radiation is used in many laboratories to identify synthetic stones, as they exhibit abnormal fluorescence. The exception is the synthetic orange sapphire, as the natural orange sapphire is itself highly fluorescent and not easily distinguishable from the synthetic product. Optical test methods may be suitable only for optically transparent or partially transparent gemstones, and secondary ion mass spectrometry (SIMS) is expensive, laborintensive, and requires expertise. In addition, the above methods do not identify the chemical nature and origin of gemstones.
As an alternative to the above testing methods, Raman spectroscopy is nondestructive, extremely fast, and low in cost. It is also sensitive to highly symmetric covalent bonds that possess little or no natural dipole movement. The Raman fingerprint allows gemologists to identify the chemical identity and origin of the gemstone based on the Raman spectral ID comparison to the library spectra for gemstones from various sources. A Raman spectrometer produces precise and distinctive spectra for all classes of minerals containing borates, carbonates, halides, native elements, oxides, phosphates, silicates, sulfates, and sulfides.
As shown in Figure 1, diamond has a carbon–carbon vibration Raman spectrum showing a single Raman shift at 1332 cm-1, which confirms the authenticity of pure diamond. Silicon wafer has a signature Raman shift at 520 cm-1. The Raman shift at 300 cm-1 indicates the gemstone is a germanium.
 Figure 1 – Comparison of spectra in terms of Raman shift for diamond, silicon, and germanium (© Copyright Thermo Fisher Scientific, Waltham, MA. All rights reserved. Image reproduced with permission of Thermo Fisher Scientific.)
After a 0.1-sec scan, the GemScan 1350 Raman spectrometer and data comparison software (AcuTech Scientific, Inc., San Diego, CA) can identify a gemstone or mineral for spectral fingerprinting. Raman spectral fingerprints for the chemical components of jade components SiO2, Al2O3, Cr2O3, Fe2O3, MgO, CaO, and Na2O have signature Raman spectra between 300 cm-1 and 1100 cm-1. A comparison of type A jade, resin-filled type B jade, and quartz is shown in Figure 2. Distinctive Raman spectral differences between diamond, moissanite, and quartz are shown in Figure 3, and spectral differences between natural red coral and dyed coral are shown in Figure 4. The red trace in Figure 4 represents the presence of carotenoids and parrodines; these two natural color pigments are missing in the dyed corals (blue trace).
 Figure 2 – Comparison of Raman spectra of a natural type A jade, resin-filled type B jade, and quartz. Data obtained from GemScan1350. (© Copyright AcuTech Scientific, Inc. All rights reserved. Image reproduced with permission of AcuTech Scientific, Inc.)
 Figure 3 – Raman spectra of diamond, moissanite, and quartz measured on inVia confocal Raman microscope from Renishaw (West Dundee, IL). (© Copyright Renishaw plc. All rights reserved. Image reproduced with permission of Renishaw.)
  Figure 4 – Spectral differences between natural red coral and dyed coral. The spectral peaks for red coral are 1129 cm-1 and 1517 cm-1; for dyed coral there is a single, high-intensity spectrum at 1089 cm-1 (© Copyright Gem Testing Laboratory, Jaipur. All rights reserved. Image reproduced with permission of Gem Testing Laboratory, Jaipur.)
 Fast Raman spectral identification
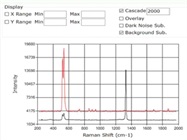
The GemScan1350 Raman molecular spectral identification and data-handling system characterizes gemstones in less than 2 seconds. It comprises x-y-z lead screws and a turntable for 3-D control and laser scanning. A laser scans and identifies the Raman spectral fingerprint of a loose small diamond as well as large gemstones up to 5 cm high × 10 cm diameter in 360° of the surface. Figure 5 highlights the difference between diamond and diamond simulant on the market. The Raman shift for this diamond simulant has a broader Raman spectrum with six major Raman shifts. The VVS1-F grade diamond has a single carbon-carbon Raman shift at 1332 cm-1. Figure 6 highlights the difference between diamond and counterfeit. Note the counterfeit has been identified as quartz at a 520 cm-1 Raman spectrum wavenumber.
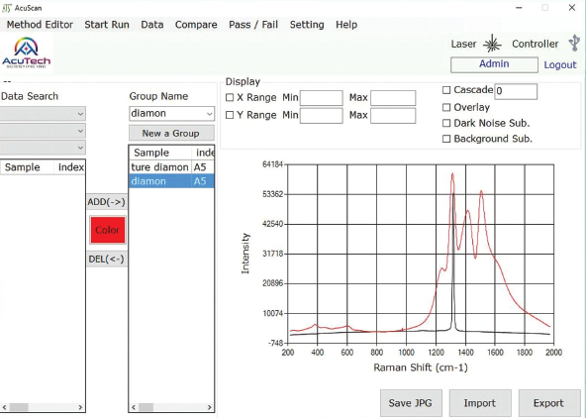 Figure 5 – Comparison of Raman spectrum of a VVS1-F grade diamond (black spectrum) to a diamond simulant (red spectrum). Data obtained from GemScan1350. (© Copyright AcuTech Scientific, Inc. All rights reserved. Image reproduced with permission of AcuTech Scientific, Inc.)
 Figure 6 – Raman spectra comparison for diamond (black spectrum) and counterfeit (red spectrum). Data obtained from GemScan1350. (© Copyright AcuTech Scientific, Inc. All rights reserved. Image reproduced with permission of AcuTech Scientific, Inc.)
The authors are with AcuTech Scientific, Inc., 325 W. Washington St., San Diego, CA 92103, U.S.A.; tel.: 408-868-7707; e-mail:[email protected]; www.acutechscientific.com