Featured Article
A virtual instrument (VI) system developed for measuring the validity period of drugs is based on a graphical programming language (LabVIEW, National Instruments Corp., Austin, TX). Experimental results demonstrate that various functions in dynamic experiments and research—including time scanning, real-time display of scanning curves, examination of scanning data, and data storage—can be achieved with this system. The VI system comprises a computer, spectrophotometer, and constant temperature oven. A model 722S spectrophotometer from Shanghai Jinghua Technology Instruments Co., Ltd. (Shanghai, China) was used to transfer test data to the computer through its serial ports.1
The software system includes two sub-VIs: data acquisition and data analysis for realizing various functions such as time scanning, data storage, data analysis, and result generation. Different sub-VI programming functions are executed through event response by event structures.
A data acquisition programming screen is shown in Figure 1. According to the data protocols sent via the serial ports of the spectrophotometer, various functions can be enabled through the VISA nodes in LabVIEW, including initialization, writing, reading, and closure of the ports. The timed loop in the structure template allows realtime time scanning.
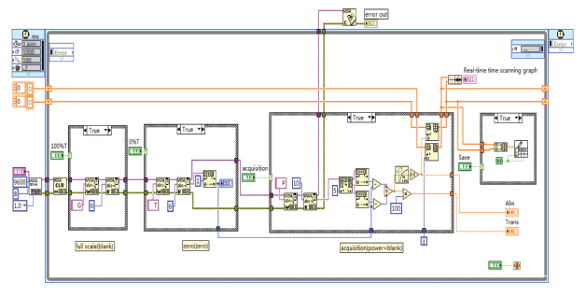 Figure 1 – Data acquisition program.
In Figure 1, four case structures are applied, from left to right, for full-scale adjustment, zero setting, sampling, and data storage. Before sampling, the full scale of the apparatus needs to be adjusted (100% T) to automatically regulate the magnification factor of the apparatus. The apparatus is adjusted to 0% T to automatically return to zero and ensure a correct test state. Adjusting to full scale means that equipment signals are regulated using the VISA Write function, and the returned equipment data (blank) are read through the VISA Read function. The zero setting refers to zeroing the equipment by initiating the VISA Write function, and the zeroing data (zero) are read through the VISA Read function. Continuous sampling initiates the sending equipment to read the data operating signals through the VISA Write function, while the current test data (power) is read by the VISA Read function. Transmittivity and absorbance are calculated using relevant functions of the numeric subtemplate in LabVIEW and logarithm base 10 function, that is, trans = (power-zero)/(blank-zero) * 100 and abs = –lg (trans/100). The collected data are deposited and sent to the graph for real-time display by executing Insert into the Array and Shift Register. For follow-up data processing, the real-time data are saved by implementing the Write to Spreadsheet File. vi function.
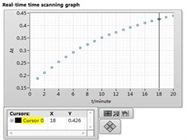
The data acquisition operation panel is displayed in Figure 2, with function preference shown on the left. Various operations can be selected; for example, clicking “acquisition” initiates real-time time scanning of the spectrophotometer. Absorbance and current collecting time data are shown on the right graph in real time. Collected absorbance and transmittivity are updated in real time on the result display. Dynamic waveform adjustments can be made by using the tool bar at the bottom of the graph. Adjustments include automatic scaling, graph dragging, cursor movement, graph zooming, and curve color setting. Test data and time can be saved in real time by clicking “save data,” while the data analysis panel can be opened to conduct relevant data analysis by clicking “data analysis.”
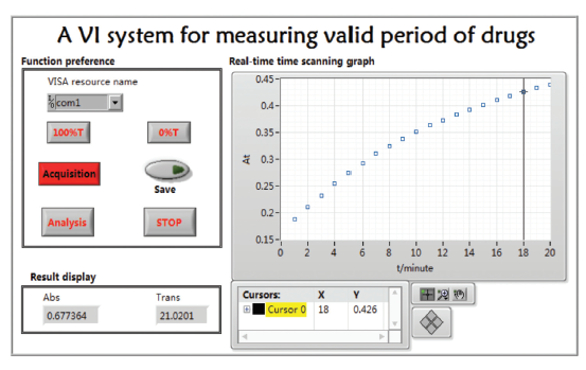 Figure 2 – Main operation panel.
Data analysis and result generation
Data analysis and result generation are based on the characteristics of first-order reaction dynamics and the principle that concentration changes of products are measured by a spectrophotometer according to the changes in reaction colors. An example of a first-order reaction is the transformation of tetracycline into anhydrotetracycline in acid solution. In molecules of anhydrotetracycline, the numbers of conjugated double bonds increase and the color deepens, such that absorbance A exhibits a function correlation with concentrations of anhydrotetracycline. Under acidic conditions, A∞ refers to the absorbance when tetracycline is completely dehydrated into anhydrotetracycline, and At represents the absorbance at time t when a portion of tetracycline is converted into anhydrotetracycline. Therefore, the first-order kinetic equation can be expressed as ln(A∞ – At) = –kt + lnA∞. While conducting experiments at different temperatures, the rate constant k can be measured under different temperatures. The curve between lnk at different temperatures and 1/T is drawn according to the Arrhenius equation, and then activation energy of the reaction can be obtained based on linear fitting. Subsequently, after shifting the fitting line to 25 °C, the rate constant k25 at the temperature can be acquired. On this basis, one can calculate the validity period of the drug t0.9 = 0.1054/k25 under the temperature.
A data analysis and result generation screen is shown in Figure 3. The stored time scanning data at different temperatures are read by using For loop and Read from spreadsheet file.vi functions in the left case structure. By applying Shift register, multigroup data were deposited and used for subsequent analysis and processing. The rate constant k and fitting data of each group of temperature data can be acquired by applying Natural Logarithm and Linear Fit.vi functions in Mathematics. In the middle case structure, data in different temperature groups (including fitting data and original data before fitting) are packed into a curve diagram for real-time display through the Bundle and Build Array. Curves before data processing and fitting quality of fitting curves can be seen from the front panel graphs. The correlation coefficient after fitting is not provided by the linear fitting function in Mathematics of LabVIEW. Correlation coefficient is needed for evaluating linear correlation degree between two variables. Therefore, the correlation coefficient is constructed using the Formula Node function based on the principle of least squares. Subsequently, rate constants and correlation coefficients of each temperature group after linear processing are transformed into character strings and then input into character string control for display through Concatenate Strings. According to the Arrhenius equation, the linear graph between the rate constants lnk of different temperature groups obtained through linear regression and 1/T is drawn by initiating the Linear Fit.Vi function and inputting into the graph for real-time display. Next, according to the fitting parameter, the rate constant k25 at 25 °C is calculated by applying the relevant calculation functions in Mathematics to determine the validity period of the drug at the temperature and activation energy of the reaction.
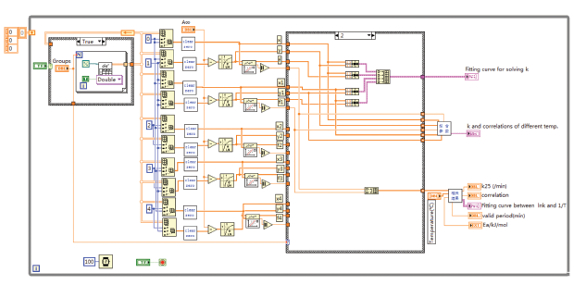 Figure 3 – Data analysis and result generation program.
In the data processing and result generation operation panel (Figure 4), the upper left and upper right of the graph show parameter input and result generation. The left lower part represents the linear fitting curve for solving rate constants of different temperature groups, while the right lower shows the fitting curve between rate constants lnk of different temperature groups and 1/T. After inputting the group numbers for data processing, the maximum absorbance A∞ and experimental temperature of data processing, users can click “reading” to call the dialog box for selecting data. Next, the real-time results are output after selecting relevant data, while the left lower area in the graph displays the fitting curve at different temperatures. The result display shows the rate constants of different temperatures and the fitting correlation coefficients. In the lower right are the fitting curve between rate constants lnk at different temperatures and 1/T. The result display shows correlation coefficient of the fitting curve, activation energy of the reaction, rate constant k25, and validity period of the drug at 25 °C in real time.
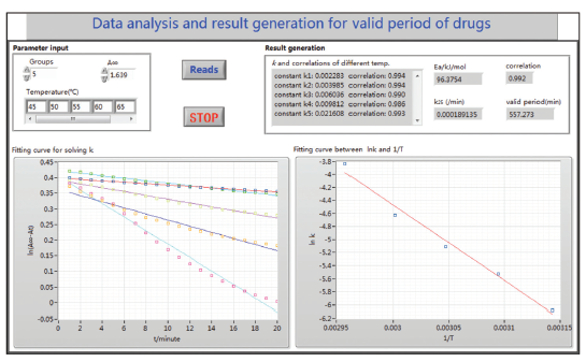 Figure 4 – Data processing and result generation panel.
Results and discussion
Concentrated hydrochloric acid (1.179 g/cm3 ) of 10 mL was added to a diluted hydrochloric acid solution of 50 mL with purified water. Chlortetracycline hydrochloride of 0.5 g was weighed to prepare a chlortetracycline hydrochloride solution of 100 mL after adding purified water. Next, the prepared chlortetracycline hydrochloride solution of 15 mL was placed into a 25-mL dry conical flask, and diluted hydrochloric acid solution of 2.5 mL was placed into another 25-mL dry conical flask. During preliminary experiments, the solution in the two conical flasks was mixed with a pH of 1. Subsequently, the two dry conical flasks were rapidly mixed and poured into the quartz cuvette after immersion in constant-temperature water at 45 °C for 5 min. Next, the solution in the quartz cuvette was measured through the spectrophotometer at a wavelength of λ = 445 nm containing a constant-temperature apparatus and was held at 45 °C. The validity period of the drug was measured for 25 min after clicking the “acquisition” button on the VI system panel, after which the “save data” button was clicked to preserve current time scanning data in real time. The time scanning data were measured at constant temperatures of 50, 55, 60, and 65 °C by repeating the above steps.
The remaining mixed solution was placed into the water bath at 100 °C for 1 hr, and A∞ was detected with the spectrophotometer at λ = 445 nm. After the temperature data were preserved, the data analysis and result generation panel was opened by clicking “data analysis,” as shown in Figure 4. The left bottom of the operation panel displays in real time the original data and fitting curves at five different temperatures. Shown are the rate constants and correlation coefficients of the fitting curves at five different temperatures, and the correlation coefficients were all more than 0.99. The bottom right of the operation panel displays the fitting curve between rate constants and 1/T at five temperatures, and the activation energy of the reaction was calculated to be 115 KJ/mol based on the slope of the linear fitting. The result display shows the correlation coefficient of the fitting was 0.996. According to the fitting parameter, the rate constant and validity period of the drug at 25 °C were calculated as 1.374E-4 min-1 and 767 min, respectively. Table 1 displays the validity periods and activation energies obtained using the VI system and manual work.
Table 1 – Validity periods and reaction activation energies of chlortetracycline hydrochloride measured through accelerated experimental method 
Conclusion
LabVIEW’s built-in function library enables data acquired by computers to be analyzed and processed to obtain corresponding measurement results in real time. The VI system for measuring the validity period of drugs enhances the performance of spectrophotometers.
Reference
- Salter, G.; Range, K.; Salter, C. J. Chem. Ed. 2005, 82(2), 297–8.
Xun Gong is with the School of Food and Pharmaceutical Engineering, and Wen Wu, Qijun Wu, and Cheng Cai are with the School of Chemical Engineering, Guizhou Institute of Technology, Guiyang 550003, China; e-mail: 20140560@git. edu.cn. The authors acknowledge the financial support of this research by the National Natural Science Foundation of China (grant no. 21667010) and support from Guizhou Province planning of education sciences (grant no. 2016A050). They also acknowledge the financial support of the Natural Science Research Project of Guizhou Provincial Education Office (grant nos. [2013] 180 and [2013] 181) and the Guizhou province science and technology cooperation project (LH [2015] 7095).