Featured Article
The Clean Air Act of 1990 was passed to regulate 189 hazardous air pollutants (HAPs) at the fence lines of chemical plants.1 Since that time, the U.S. EPA has required refineries to reduce the amount of benzene in gasoline, resulting in a reduction of benzene emitted to the atmosphere. Some of the changes in the refining process were described by Nielson2 to reduce the benzene content in gasoline. In 2011, the U.S. EPA reduced the specification of benzene content in gasoline to 0.62%. In addition, it added a renewable fuel standard of 10% ethanol for gasoline. In October 2015, EPA issued refinery fence line standards for benzene of 9 μg/m3 or 2.82 ppm benzene from refineries and chemical plants.3 Benzene ranks in the top 20 chemicals in production volume, so there are a number of other sources.
This article describes methods of preparing standards, materials used, and performance of a handheld portable gas chromatograph with a photoionization detector (GC/PID) for the analysis of ppb levels of benzene at the fence line.
Materials and description
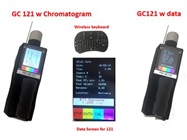
A Model 121 handheld gas chromatograph (GC121, Figure 1) equipped with a photoionization detector (PID Analyzers, LLC, Sandwich, MA) was used to perform the work described here. The handheld, battery-operated GC weighs only five pounds. It provides separation and detection of ppb levels of volatile organic compounds (VOCs) with the PID, which can be programmed to detect benzene only. The GC displays the chromatogram in the run mode and the chromatographic rendition on the data screen. It is programmable and features password protection. Data, including the chromatogram, is saved in ASCII format on a 16-GByte SD card and can be imported directly into Microsoft Excel. The GC has both Wi-Fi and Bluetooth capabilities. Specifications are given in Table 1.
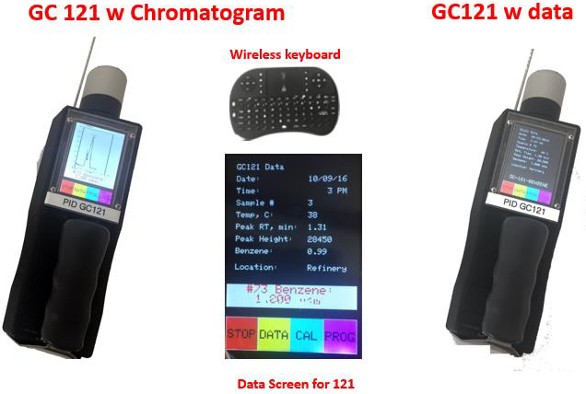 Figure 1 – GC121.
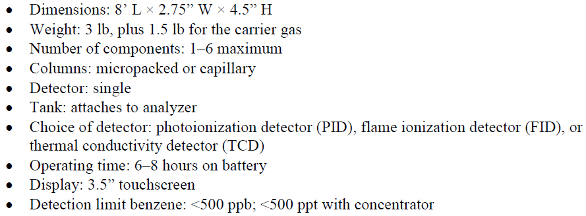
Table 1 – GC121 specifications
A capillary column was used to separate the benzene from other hydrocarbons that could be potential interferences from a refinery effluent. The high-pressure fluidics for the system consist of a 1/8” quick-disconnect fitting mounted on the base and a 0.3-L gas cylinder for high-purity nitrogen carrier gas (filled to 1500 psi). There is a 3000-psi burst disk in the system; this cylinder contains 30 L of carrier gas. At 10 cc/min, it operates the GC for about 30 hours. A PID Analyzers 10-port valve was used to inject the sample.
Benzene levels from 20 to 1000 ppm were obtained by dynamically diluting a 1-ppm standard of benzene in air with zero air measured with a digital flowmeter. For lower levels, a VICI Metronics (Poulsbo, WA) benzene permeation tube was used. Hydrocarbon standards (ACS grade) were purchased from MilliporeSigma (St. Louis, MO). Interference studies used a 1-L Hamilton syringe filled with a benzene standard spiked with pentane, hexane, cyclohexane, heptane, or octane measured with a Hamilton Microliter liquid syringe that provided a range of 20–50 times the benzene concentration.
Results and discussion
The photoionization detector was described by Driscoll4-6 as being 50 times more sensitive than the flame ionization detector for aromatic hydrocarbons. Photoionization is initiated by absorption of a high-energy photon (10.6 eV), resulting in the formation of a positive ion and an electron if the energy of the photon is greater than the ionization potential (IP) of the molecule. The ionization chamber, located adjacent to the lamp, contains a pair of electrodes, where a positive bias is applied to one electrode, and the current, which is proportional to concentration, is measured at the collection electrode.
Table 2 – Ionization potentials
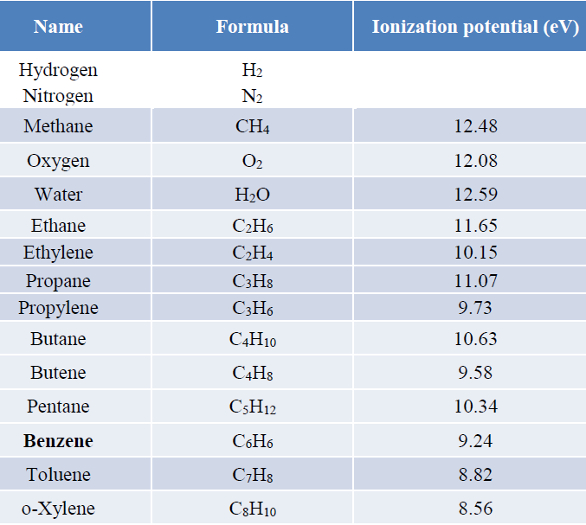
A list of IPs is given in Table 2. Note that the alkanes (methane, ethane, propane, and butane) have no unsaturation (sigma bonding) where the electrons are more tightly bound and have higher IPs (no ionization), while alkenes and aromatic have pi bonding with lower IP and consequently more sensitivity.7 Inert gases such as nitrogen, helium, and argon have very high IPs and make excellent carrier gases. Note that the IPs of C1–C3 alkanes have considerably less lamp energy, so they will not respond on the PID. Butane does respond, but sensitivity is very low. A sixfold excess of C5–C8 and ethylene were added to a benzene standard; the chromatograms are shown in Figure 2. While these compounds respond, benzene is still able to be separated from them on the capillary column chosen. Separation can be completed in under 2 minutes.
 Figure 2 – Chromatograms of benzene with alkane and alkene (C2H4) potential interferences.
The PID has a dynamic range of 107, which is the widest linear range of any GC detector. The linear regression equation for benzene from 10 to 1000 ppb is Y = 4.299x – 1.8682 with a correlation coefficient (r2) of 1.00. A 10-ppb concentration of benzene was prepared by diluting 10 cc of a 1-ppm standard with zero air. Eight samples were run with an AC-powered concentrator. An average concentration of 13.56 ppb, SD of 1.96 ppb, and coefficient of variation (precision) of 14.52% were obtained. The detection limit for benzene was 0.05 ppb; the detection limit of the PID without any preconcentration is about 1–2 ppb. The manufacturer is working on a low-power preconcentrator for the GC121 that will enable the detection of ppt levels of benzene and other hydrocarbons at ppt levels.
OSHA Method 37008 for benzene is a portable GC/PID with a range of 10–1000 ppb and an upper limit of 500 ppm for a 1-cc injection. This GC might have interferences for low-ppb measurements of benzene for refinery fence line measurements. A review and background on photoionization are given in Ref. 9.
Conclusion
The compact, handheld GC121 measures toxic gases at ppb levels in the workplace and at fence lines. The detection limit for benzene is about 1 ppb. A GPS sensor can be added so that the location is available for the data that is saved. This would allow a sample to be taken and moved to the next location while the analysis continues to completion (1.5–2 minutes).
References
- https://www.epa.gov/clean-air-act-overview/1990-clean-air-act-amendment-summary
- Nielson, R. Gasoline benzene removal. Process Economics Program. Report #273. SRI Consulting, Menlo Park, CA, 2009.
- EPA Fence Line Monitoring & Method 325 A/B, Oct. 2015.
- Driscoll, J.N. and Spaziani, F.F. Applications of a photoionization detector in gas chromatography. Am. Lab. 1976, 9, 71.
- Driscoll, J.N. and Clarici, J.B. Ein neu photoionization detecktor fur gas chromatographie. Chromatographia 1976, 9, 567.
- Driscoll, J.N. Evaluation of a new photoionization detector for organic compounds. J. Chromatogr. 1977, 134, 49.
- Driscoll, J.N.; Ford, J. et al. Gas chromatographic detection and identification of aromatic and aliphatic hydrocarbons in complex mixtures by coupling photoionization and flame ionization detectors. J. Chromatogr. 1978, 158, 171.
- https://www.osha.gov/Reduction_Act/1218-0129.html
- Driscoll, J. Photoionization. In: Important Instrumentation and Methods for Detection of Chemicals in the Field. Smith, P.A. and Cook, G.W., Eds.; AIHA, 2012; ISBN 978-1- 935082-41-5.
Jack Driscoll is president, and Jennifer Maclachlan is sales and marketing manager, PID Analyzers, LLC, 2 Washington Cir., Sandwich, MA 02563, U.S.A.; tel.: 774-414-5282; e-mail: [email protected]; www.hnu.com. This paper is based on research presented at the American Chemical Society Analytical Chemistry Division’s poster session at Pittcon 2017, Chicago, IL.