Featured Article

Biopharmaceutical companies isolate many types of proteins for use in experimental and therapeutic medicines. Unfortunately, when removed from their native environments, proteins become less stable. Unstable proteins are more prone to degradation from the primary stress mechanisms: mechanical and thermal (from manufacturing, storage, and transport) and biological (from drug delivery). The challenge for biopharmaceutical companies is that degraded proteins create ineffective and potentially harmful therapeutics for their customers. To mitigate against protein degradation, drug companies employ formulation development.
A formulation is one solution condition in a multidimensional therapeutic trade space. This trade space includes factors such as solvent choice, ionic strength, pH, concentration, and excipients. For each therapeutic, biopharma companies use formulation development to search for the unique “goldilocks zone” where the solution is stable in all the required conditions. Because most therapeutic protein formulations are difficult and expensive to produce at high yields, biopharma companies need tools that provide rapid, high-quality protein stability information with low sample consumption. ARGEN from Fluence Analytics (New Orleans, LA) provides this information and allows independent and real-time testing of up to 16 simultaneous samples.
ARGEN enables multiple independent light-scattering experiments, each one with its own stressor conditions. Additionally, users can introduce and remove samples from testing without affecting other ongoing measurements. Testing each sample independently allows for control and rapid characterization of multiple stressor conditions in each study, expediting formulation solution condition exploration. Researchers can quickly detect changes in the relative molecular weight for molecules in solution, enabling them to identify the onset of aggregation, degradation, or a phase change more rapidly than with other technologies.
Because ARGEN’s 16 experiments are fully independent, users can determine aggregation or degradation characteristics for all samples simultaneously, regardless of their individual time spans (some can take minutes; others can take weeks). When one sample is complete, another can immediately take its place. Further, since all data are generated continuously and in real time, ARGEN analysis methods can determine the kinetic aggregation rate (AR) for each sample independently. The aggregation or degradation rate offers a valuable and accurate measurement for colloidal stability for proteins and polymer solutions.
This application note summarizes the use of ARGEN to determine colloidal stability for bovine serum albumin (BSA) at three different solution pH levels. Formulation development teams can use kinetic data collected by ARGEN to see differences in AR within solutions containing surface charged and surface neutral proteins, i.e., above or below their isoelectric point.
Methodology
Proteins, such as BSA, are made up of amino acids and are naturally amphoteric molecules, neutrally charged; therefore, the solution pH dictates the type and distribution of surface charge for each protein molecule. This charge distribution affects both intermolecular and intramolecular interactions among protein molecules. Intermolecular interactions are particularly important because they directly affect how quickly a given formulation experiences aggregation. This is particularly true for pH levels within and outside the isoelectric point for a molecule. In a study of BSA aggregation behavior at various pH levels, via fluorescence measurements using an FP-6500 spectrofluorometer (Jasco, Easton, MD), tests confirmed that pH levels close to the isoelectric point (4.7) of BSA induced faster growth of macromolecular aggregates compared to the same sample monitored at a pH of 5.7.1 An explanation for this change in pathway concerns intermolecular interactions that change as a net surface charge is introduced or extinguished.
To demonstrate the utility of using ARGEN in determining the colloidal stability for BSA, three stock solutions were prepared with varying pH levels: 2.75, 4.75, and 6.75. These pH levels were chosen to test the stability of the formulation inside and outside of the isoelectric point for BSA where the change in pH significantly impacts the overall stability of the sample. In each set of experiments, the sample was dissolved at a concentration of 1 mg/mL in a 50-mM phosphate-buffered saline solution. An aliquot of each sample was then pipetted into each of the 16 independent ARGEN light-scattering cuvettes. The outer windows of the cuvettes were cleaned and placed into the ARGEN system. Each cuvette was continuously and independently monitored at isothermal conditions between 40 °C and 80 °C.
Results
As previously indicated, changes to the pH of a buffer solution drastically affect the overall sample stability and propensity to aggregate when stressed. As an example, the effects of changing pH are clearly shown in Figure 1, where the AR for BSA at 55 °C changes at different pH values. Increasing the pH to 6.75, two units above the isoelectric point, greatly reduces the AR, whereas decreasing the pH to 2.75, two units below the isoelectric point, eliminates aggregation. The decreasing value of molecular weight (norm) and the negative rate of change, however, indicate that the BSA sample held at pH 2.75 is degrading, likely due to acid hydrolysis.2
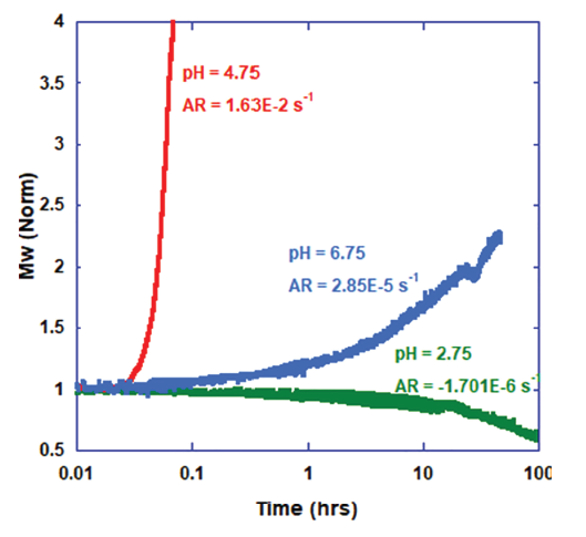 Figure 1 – Mw (norm) of BSA at 55 °C for three different pH values.
Figure 2 shows an overlay of typical normalized molecular-weight (Mw [norm]) data generated from conducting multiple isothermal ARGEN measurements for a single formulation. The interpretation of these measurements, as shown in the figure, displays a clear trend of faster aggregation and greater instability with increasing temperatures. This is typical of BSA and many other protein or therapeutic biologics.
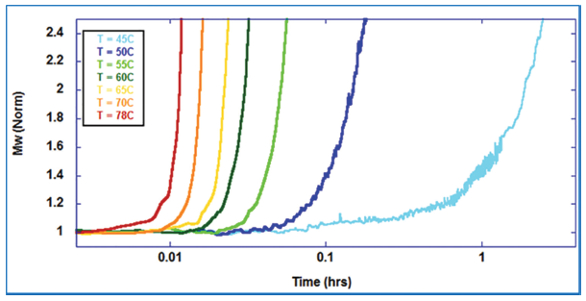 Figure 2 – Mw (norm) for BSA pH 4.75 at different temperatures.
Figure 3 shows the analysis interface within the ARGEN control software that determines the AR. In determining the AR for a given sample, the user must identify the initial scattering value as indicated by the Mo flag. The initial linear portion of the scattering signal must also be identified and marked with the Ar-1 and Ar-2 flags.
 Figure 3 – ARGEN analysis interface.
ARGEN’s ability to capture kinetic responses of therapeutic formulations to thermal stress over long time frames makes it well-suited for developing formulations resistant to conditions experienced during downstream processing, storage, transportation, and delivery. The data and insight gathered from the program’s continuous monitoring methods can be used to compare the stability of proteins and other formulations. As described in Ref. 3, the generation of an Arrhenius plot allows for vivid and direct visualization of aggregation rates under various conditions. The Arrhenius plot also yields activation energies (ΔEact) and activation energy zones. When Arrhenius plots are generated and used in conjunction to determine formulation stability, the information portrays the overall sample formulation stability over large temperature ranges, as shown in Figure 4.
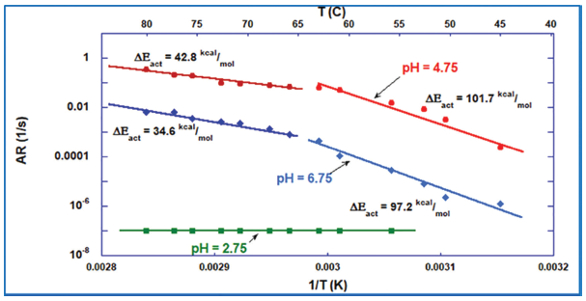 Figure 4 – Arrhenius plot comparison of BSA formulations.
The Arrhenius plots shown in Figure 4 are constructed from measured ARs of temperatures ranging from 40 °C to 80 °C at pH levels of 2.75, 4.75, and 6.75. ARs are determined using ARGEN’s analysis software, which are plotted against the inverse temperature to reveal zones of ΔEact. Note, however, that there is much information available about the sample stability in determination of the true AR for the formulation as a complete function of temperature. As illustrated, there are more than two orders of magnitude difference in AR at 55 °C between the BSA sample prepared at pH 4.75 and pH 6.75. The values displayed in the figure show that, although there is a very large difference in aggregation propensity, it is not reflected at all in the values of ΔEact. It is common knowledge that nearly all proteins will rapidly begin to aggregate if heated above the Tm temperature; therefore, characterizing the aggregation propensity of a sample above or near the Tm value does little to indicate its stability at regular storage temperatures. Monitoring the isothermal stability of proteins sufficiently below Tm (Tm minus 10 °C), however, allows researchers to quantify significant differences in AR, as seen in Table 1.
Table 1 – Arrhenius plot analysis statistics 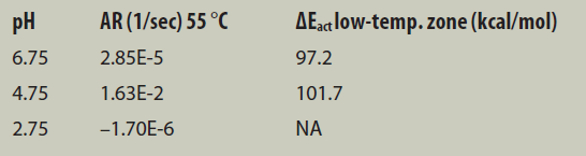
Additionally, as displayed in Figure 4, the sample BSA prepared at pH 2.75 did not exhibit an inflection point. In some schools of thought, this would indicate that it is the most stable sample but, in reality, as seen only by ARGEN, the low pH was actually inducing a degradation effect on the protein.
The AR data in Table 1 show that BSA at 55 °C in pH 6.75 formulations is 200% more stable than in pH 4.75, whereas the calculated ΔEact only show a 4.52% difference. In fact, if accepted based on value alone, the ΔEact for pH 4.75 would indicate that it is marginally more stable than the formulation at pH 6.75.
Now that the AR clearly identifies the most stable sample formulation as a function of pH, the next step in the optimization of the formulation is to narrow the pH range around pH 6.75 and introduce other formulation variables such as ionic strength and stabilizers (e.g. arginine, sucrose, etc.). ARGEN permits very rapid assessment of stability under these varied conditions, allowing for the determination of the optimum formulation.
Conclusion
ARGEN can bolster and guide new and existing formulation development studies, not only for BSA, but for many other biologic molecules. In addition, ARGEN can be used orthogonal to or in lieu of fluorescence techniques to determine colloidal stability for a given biologic formulation. Its ability to determine aggregation rates allows for direct and quantitative comparisons of protein stability under different formulation conditions. This is important because aggregation mechanisms are still poorly understood, and pose a threat to the viability of biopharmaceutical development at both the R&D and downstream processing stages.
References
- Vetri, V.; Librizzi, F. et al. Thermal aggregation of bovine serum albumin at different pH: comparison with human serum albumin. Eur. Biophys. J.2007, 36(7), 717–25.
- Estey, T.; Kang, J. et al. BSA degradation under acidic conditions: a model for protein instability during release from PLGA delivery systems. J. Pharm. Sci.2006 Jul, 95(7), 1626–39.
- https://docs.wixstatic.com/ugd/250f6c_6cda4e5f54a2434b8c80e78e 452d2b7c.pdf
Additional reading
- Wang, W. and Roberts, C. Aggregation of Therapeutic Proteins. Wiley, 2010.
Michael Drenski is CTO, Fluence Analytics, 1078 S. Gayoso St., New Orleans, LA 70125, U.S.A.; tel.: 504-434-4366; e-mail: [email protected]; www.FluenceAnalytics.com