Featured Article
When a chromatographic assay is developed, the instrumentation has an impact on the separation. This impact can be evident in the retention time shift due to gradient delay volume, or in the loss of resolution from extra-column dispersion. Whatever the effect, testing on every type and class of chromatographic system is not always practical or possible. This is especially true if the method is being transferred globally to another laboratory with different instrumentation, environmental conditions, or reagent supply.
To add further complexity, the growth of liquid chromatography over the past 50 years has been accompanied by an increase in the number of LC instruments available as well as the number of manufacturers. As manufacturers look to modernize or update their systems, new capabilities, including higher pressure and lower-dispersion systems, are accessible. The range and capabilities of these systems can vary, making method transfer more complex. Some factors that affect method transfer will be discussed here, particularly as they relate to the analysis of isoflavones in soy extract.1,2 In addition to the particular attributes, strategies for adjustments will be outlined.
The influence of dwell volume on retention times
The analysis of isoflavones3 was performed on two different quaternary systems with the same column, sample, and method conditions (Figure 1). Method transfer across the two systems showed that the original system (Figure 1a) produced retention times that were significantly later than the second or receiver system (Figure 1b). To understand what factors could cause the retention time shift, the pump characteristics and how it affects mobile phase delivery need to be considered.
 Figure 1 – Impact of dwell volume on method transfer across chromatographic systems. Transfer of the separation of isoflavones in unheated soy extract shows the impact of dwell volume (VD) on retention times. By adjusting for differences in dwell volume, retention times are better aligned. Analytes: 1) daidzin, 2) glycitin, 3) genistin, 4) malonyl daidzin, 5) malonyl glycitin, 6) acetyl daidzin, 7) acetyl glycitin, 8) malonyl genistin, 9) glycitein, 10) acetyl genistin, 11) genistein, 12) apigenin.
The dwell volume (or gradient delay volume) of every LC system is the volume of liquid contained in the system between the point of gradient formation and the head of the column. Dwell volume is impacted by the mode of gradient formation, installed mixers, volume of the injector, and connecting tubing. For example, in a quaternary pump—with low-pressure mixing—the dwell volume consists of the gradient proportioning valve, mixer, pump head, injector, and system tubing. In a binary pump—with high-pressure mixing—the dwell volume comprises the mixer, injector, and system tubing. For these reasons, two systems with the same pump can have different dwell volumes if any part is different.
Given these factors, measurement of a system’s dwell volume provides a more comprehensive understanding of a system. The most commonly described method4-6 requires delivery of a 0–100%B gradient using the same mobile phase composition in both A and B lines with the addition of a UV tracer in the latter. The dwell volume is calculated from the difference in time between 50% absorbance (red trace) and the programmed gradient at 50% (black trace). Converting this difference into volume (time × flow rate) results in the dwell volume (Figure 2).
 Figure 2 – Method for determining a system’s dwell volume. The dwell volume is calculated by determining the time at which the UV spectrum measures 50% absorbance (t½). The difference between this value and 50% of the programmed gradient (1/2 tG) equals the dwell time (tD). This value is converted to dwell volume (VD) by multiplying with the flow rate (F). For all systems, a restrictor was used to ensure that all measurements were within a system’s recommended operating pressures. (A version of Figure 2 was previously published in Ref. 6.)
To troubleshoot the method transfer of isoflavones (Figure 1), the measurement of each system’s dwell volume was performed. As shown in Figure 1, the dwell volume (VD) for the original system was measured to be 1.08 mL, while the second or receiver system had a significantly lower dwell volume of 0.38 mL. This discrepancy caused the shorter retention times for the receiver system as compared to the original system (Table 1).
Table 1 – Retention time comparison of method transfer of isoflavones in unheated soy extract*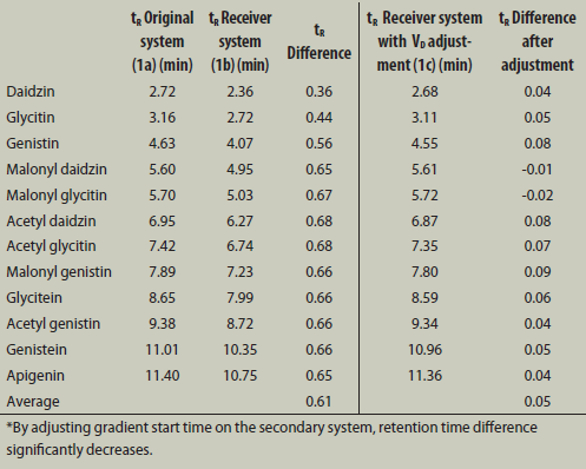
However, there are strategies to address dwell volume differences across systems. The USP recognizes the impact dwell volume can have on a separation. For that reason, within the guidelines, “If adjustments are necessary…, the duration of an initial isocratic hold (when prescribed), and/or dwell volume adjustments are allowed.”7 Therefore, for the example previously described, an isocratic hold can be added to the receiver system (VD –0.38 mL) to match the dwell volume of the original system (VD –1.08 mL). As shown in Figure 1c, this difference, which corresponds to 0.700 mL, was added as an isocratic hold to the gradient table of the receiver system (Figure 1c). The results produced retention times (tR) comparable to the original system with a decrease in the average tR difference from 0.61 to 0.05 min (Table 1). By adjusting the initial isocratic hold, retention time-based identification is possible across both systems.
The influence of extra-column dispersion on resolution and sensitivity
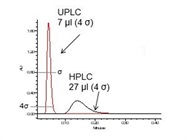
 Figure 3 – Impact of extra-column dispersion on method transfer of flavones in orange extract. Transfer from a UPLC system (3a) to an HPLC system produces wider peaks and lower resolution on the latter (3b). Measurement of extra-column dispersion6 of a caffeine injection (3c) reveals higher extra-column dispersion on the HPLC system. Column: CORTECS C18 +, 2.1 × 75 mm, 2.7 μm (Waters, Milford, MA).
In the next example, the analysis of flavones in orange extract, on a 2.1 × 75 mm column, was transferred from the original UPLC system to an HPLC system (Figure 3).8 This transfer resulted in broader peaks and lower sensitivity on the HPLC system. In addition, there was a significant loss of resolution (–25%), which resulted in loss of baseline resolution for the critical pair (peaks 1 and 2) from USP resolution of 2.5 to 1.6.
To understand the LC characteristics that affect peak widths, the factors that affect band broadening must be considered. Band variance (σ) or band broadening is dependent on both the intracolumn and extra-column effects (Eq. [1])9,10:

Extra-column effects or dispersion are a function of the physical components of the system, from the injector up to and including the detector flow cell. These components include tubing connectors to the column, detector flow cells, preheaters, etc. In addition, method conditions such as injection volume and detector filtering can also affect extracolumn dispersion.9-11
To get a better understanding of this characteristic, measurement of a system’s extra-column dispersion can be performed. This methodology involves replacing the column with a low-volume union and injecting an analyte (e.g., caffeine). Dispersion is calculated by:

where x = 1–5 and represents the width at the specific peak height (e.g., 4 σ – 13.4% peak height) and F is the flow rate. Applying this methodology to both systems used in Figure 3 showed a threefold difference in the extra-column dispersion between the HPLC and the UPLC systems (Figure 3c). This characteristic directly led to the broader peaks and lower sensitivity on the HPLC system. To decrease the extra-column dispersion on the HPLC system, the use of low-volume flow cells or lower inner-diameter (i.d.) tubing column connections can be explored. These changes could reduce dispersion; however, the lower pressure limit of the system eliminates the possibility of achieving very low (<10 µL) extra-column dispersion.
In addition to method transfer across two very different systems, many methods are transferred across the same type or class of system, such as the analysis of isoflavones in unheated soy extract (Figure 4a–c). In this example, method transfer across the three UPLC systems resulted in differences in peak capacity (Pc) and USP resolution (inset). Upon evaluation of the systems, differences in the tubing from the column to the detector across the three systems were observed, with i.d.s ranging from 0.004” to 0.007”. Measurement of the extra-column dispersion of the three systems revealed a greater than twofold change across the systems. The significant differences in extra-column dispersion produced the changes in peak capacity and resolution. In this example, one strategy to improve transferability across systems includes documenting tubing connections, and flow cells.
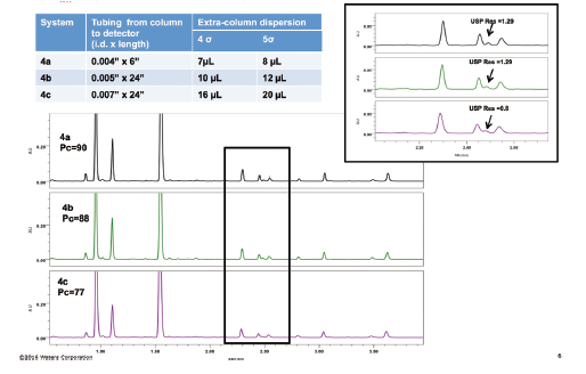 Figure 4 – Impact of tubing connections on method transfer of isoflavones in unheated soy extract. Tubing inner diameter (i.d.) and length impact peak capacity (Pc) and USP resolution (inset), with 0.007” i.d. tubing resulting in lowest peak capacity.
Method transfer or scaling from HPLC to UPLC
Method transfer in LC not only refers to the transfer of an assay from one instrument to another, but also from one column to another. For this type of transfer, specific parameters need to be adjusted for differences in column volume, particle size, and column inner diameter. This is traditionally done to take advantage of the higher pressure and lower dispersion of more modern instrumentation, as previously described. While the instrument is clearly of importance, the column dimensions and particle size also need to be considered to ensure proper geometric scaling of the method.
When transferring from HPLC to UPLC, numerous method parameters are modified along with the column dimensions to ensure proper scaling of the method. These adjustments can be used to utilize the efficiency gains of smaller particles. For example, method transfer of an isocratic separation, per the USP,7 requires column efficiency (L/dp) to remain within –25% to +50%, and the flow rate and injection volume to be adjusted for both the i.d. and particle size of the column. While changes to the gradient table are not allowed per the USP, geometric scaling allows gradient methods to be transferred to different column dimensions while retaining the original separation. This transfer requires scaling the flow rate, injection volume, and gradient steps (keeping constant column volumes).
To illustrate these effects, the separation of isoflavones was transferred from a 3.0 × 100 mm, 2.7-µm column to a 2.1 × 50 mm, 1.6-µm column. The L/dp for both columns is within the recommended ranges, with the 2.1 × 50 mm column having a value of 84% of that of the larger column. Using a method transfer calculator,12 the method conditions were scaled. The results produced a significantly shorter run time, with a decrease from 18 min to 4 min (Figure 5). The peak resolution for the analytes was slightly lower than that achieved on the 3.0 × 100 mm column but within accepted values (Figure 5). Additionally, while the method could also have been scaled to a 2.1 × 75 mm column, in this instance a direct scaling of the flow rate to the column dimensions would have led to overpressuring of the LC system. Therefore, scaling would require adjusting the method to a lower flow rate to be within the system’s operating pressure.
 Figure 5 – Method transfer or scaling from HPLC to UPLC of isoflavones in unheated soy extract.
 Method
was scaled from an HPLC 2.7-μm, 3.0 × 100 mm to a 1.7-μm, 2.1 × 50 mm UPLC column. The resulting method produced comparable
resolution in less than one-quarter of the time.Conclusion
With the ever-increasing number of LC systems available, a strategy for successful method transfer must include careful evaluation and understanding of some basic instrument characteristics. Dwell volume and extra-column dispersion impact LC separations in very different ways, but both can pose a challenge to method transfer. Gradient delays can impact retention time-based identification, while extra-column dispersion impacts resolution. Whether method transfer occurs between two HPLC systems or from a HPLC to a UPLC system, success can be improved by an understanding of each system’s characteristics.
References
- Yang, J.; Benvenuti, M. et al. Fast analysis of isoflavones in dietary supplements— method transfer to the ACQUITY UPLC H-Class System. Waters Corporation, Application note, 2017; 720006065en.
- Yang, J.; Benvenuti, M. et al. Fast Analysis of isoflavones in dietary supplements—USP method transfer onto a UHPLC system. Waters Corporation, Application note, 2016; 720005858en.
- Official Monographs, USP 39-NF34. United States Pharmacopeia and National Formulary(USP 39-NF34). United Book Press, Inc.: Baltimore, MD, 2016, p. 6841.
- Dolan, J.W. Dwell volume revisited. LC·GC North America2006, 24(5), 458–66.
- Snyder, L.R.; Kirkland, J.J. et al. Gradient Equipment. Introduction to Modern Chromatography; 3rd ed. John Wiley & Sons, Inc.: Hoboken, NJ, 2009.
- Hong, P. and McConville, P.R. Dwell volume and extra-column volume: what are they and how do they impact method transfer? Waters Corporation, Application note, 2016; 720005723en.
- Chromatography. United States Pharmacopeia and National Formulary(USP 39 NF34). United Book Press, Inc.: Baltimore, MD, 2016, pp. 459–71.
- Hong, P.; Andrews, R. et al. Simplifying methods transfer: novel tools for replicating your established methods on an ACQUITY Arc System. Application Note, 2015; 720005469en.
- Wu, N. and Bradley, A.C. Effect of column dimension on observed column efficiency in very high pressure liquid chromatography. J. Chromatogr. A2012, 1261, 113–20.
- Striegel, A.M.; Yau, W.W. et al. Band Broadening. Modern Size-Exclusion Liquid Chromatography. John Wiley & Sons, Inc.: Hoboken, NJ, 2009, pp. 49–91.
- Gritti, F. and Guiochon, G. On the extracolumn band-broadening contributions of modern, very high pressure liquid chromatographs using 2.1 mm I.D. columns packed with sub-2 μm particles. J. Chromatogr. A2010, 1217, 7677–89.
- Columns calculator Version 2.0. Waters Corporation, Available at http://www.waters.com/waters/support.htm?lid=134891632
The authors are with Waters Corporation, 34 Maple St., Milford, MA 01757, U.S.A.; tel.: 508-482-3555; e-mail: [email protected]; www. waters.com