Featured Article
The vacuum ultraviolet (VUV) spectrum has historically been limited to bright-source synchrotron facilities, but can now be accessed through VUV benchtop spectrometers. Gas chromatography-vacuum ultraviolet (GC/VUV) spectroscopy was introduced in 2014 by the VGA-100 universal gas chromatography detector (VUV Analytics, Cedar Park, TX).1 VUV detectors have the unique capability of providing spectral information that is both qualitative and quantitative for most gas-phase compounds. GC/VUV solves common GC separation challenges such as isomer differentiation, analyte coelution, and data reporting time.
Introduction
GC/VUV spectral data are inherently three-dimensional (time, absorbance, wavelength) and specific to chemical structure. Nearly all compounds absorb in the VUV spectrum measured by VUV detectors (120–240 nm) with the exception of carrier gases hydrogen, helium, and argon. The high-energy, short-wavelength VUV photons induce electronic transitions in virtually all chemical bonds including ground state to excited state σ→σ* and π→π*. The result is spectral “fingerprints” that are specific to individual compound structure and can be readily identified by the VUV library. Unique VUV spectra enable closely related compounds such as structural isomers to be clearly differentiated. VUV detectors provide the perfect complement to mass spectrometry, which struggles with characterizing constitutional isomers and compounds with low mass quantitation ions. VUV spectra can also be used to deconvolve analyte coelution, resulting in an accurate quantitative representation of individual analyte contribution to the original response.2 This characteristic lends itself to significantly reducing GC run times through flow rate-enhanced chromatographic compression.
VUV spectroscopy follows the simple linear relationship between absorbance and concentration described by the Beer-Lambert law. The straightforward nature of VUV spectral data eliminates guesswork related to retention time-based identification and makes the technology accessible to users in both R&D and production settings. Ease of use of VUV detectors is further enhanced by the ability to automate compound class data analysis. VUV absorbance spectra exhibit feature similarity within compound classes. Rapid compound class characterization can be achieved in complex samples utilizing compound spectral shape and retention index information. VUV Analyze software automation reduces the typical group analysis data processing time of 15–30 minutes to <1 minute per sample. This brief introduction to GC/VUV describes how its capabilities can be used to solve analytical challenges across a variety of difficult applications.
UV spectral identification
Gas phase species absorb and display unique spectra between 120 and 240 nm where high-energy σ→σ*, n→σ*, π→π*, n→π* electronic transitions can be probed. VUV spectra reflect the absorbance cross-section of compounds and are specific to their electronic structure and functional group arrangement. The ability of VUV detectors to produce spectra for most compounds results in universal and highly selective compound identification. VUV spectroscopy data are also highly quantitative. Many commonly used GC detectors such as the electron capture detector (ECD), flame ionization detector (FID), and thermal conductivity detector (TCD) provide quantitative but not qualitative data. GC/MS generates qualitative and quantitative information but has difficulty characterizing labile and low mass compounds, as well as differentiating between isomers. GC/VUV complements MS by overcoming its limitations and providing a secondary method of confirmation. It also offers a single instrument alternative to the use of multiple detectors for qualitative and quantitative analysis.
Naphthols, xylenes, and cis- and trans-fatty acids are compounds that are prohibitively difficult to distinguish according to their electron ionization mass spectral profiles.1 Xylenes present the additional challenge of natural coelution that makes separating their isoforms problematic. Figure 1 shows the distinct VUV spectra of m-, p-, and o-xylene. These compounds can be differentiated despite their only difference being the position of two methyl groups around a benzene ring. As will be seen later, the spectral differences of these isomers enable their coelution to be resolved through spectral deconvolution.
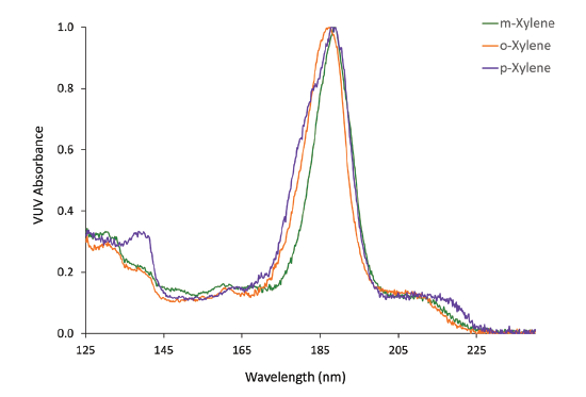 Figure 1 – Distinct VUV spectra of
 m
-, p
-, and o
-xylene. The compounds differ by only the positions of two methyl groups on a benzene ring, and are virtually impossible to distinguish by GC/MS.Fatty acid screening and profiling is an application that commonly requires the use of multiple detectors to achieve quantitative and qualitative results.2 The FID is a quantitative detector suitable for routine screening when guided by retention index information. GC/MS has traditionally been used for qualitative compound profiling, but falls short where isobaric analytes are prevalent. It especially struggles with differentiating cis- and trans-fatty acid isomers. Electron impact ionization can also cause double-bond migration and lead to ambiguous fatty acid structural data.
Determining cis- and trans-fatty acid distribution in oils and fats is important in assessing their potential health impacts. VUV spectra of trans-containing fatty acid methyl ester (FAME) isomers typically found in butter and vegetable oils are shown in Figure 2. These trans-containing isomers separate chromatographically from cis-containing isomers and have the tendency to coelute with each other and, in some cases, with select C20:1 isomers. GC/VUV is not only able to differentiate the C18:3 FAME variants, but is also capable of telling cis-isomers apart from trans-isomers. Degrees of unsaturation such as C20:1 vs C18:3 can additionally be distinguished. Previous work has demonstrated how distinct VUV spectra enable straightforward deconvolution and accurate quantitation of cis- and trans-FAME isomers.1,3
 Figure 2 – VUV spectra of FAME
 cis
- and trans
-isomers that are commonly found in butter and vegetable oils. GC/VUV can readily distinguish between the C18:3 FAME isomers, cis
- and trans
-classification, and the degree of unsaturation.Fast GC/VUV and deconvolution
Unique VUV absorbance spectra not only enable unambiguous compound identification, but also allow GC run times to be deliberately compressed. Flow rate-enhanced chromatographic compression utilizes VUV spectral deconvolution to resolve any coelution that may result from shortening GC run times. VUV absorption is additive, meaning that overlapping peaks give a spectrum that corresponds to the sum absorbance of each compound. If VUV spectra for coeluting compounds are stored in the VUV library, it is possible to determine the individual contribution of each analyte.4 VUV detectors operate at ambient pressure and are thus not flow rate limited. Chromatography can be compressed by increasing the GC column flow and oven temperature program rates.
Testing for the presence of residual solvents in active pharmaceutical ingredients (APIs) is critical for patient safety and commonly follows United States Pharmacopeia (USP) Method guidelines, or, more broadly, International Council for Harmonization (ICH) Guideline Q3C(R6). The gas chromatography run time suggested by USP Method 467 is approximately 60 minutes. A generic method for residual solvent analysis by GC/MS describes conditions that include a run time of approximately 30 minutes.5 A GC/VUV and static headspace method was developed using a chromatographic compression strategy that resulted in a GC run time of 8 minutes. The GC/VUV method uses a flow rate of 4 mL/min and an oven ramp of 35 °C (held for 1 min), followed by an increase to 245 °C at a rate of 30 °C/min. Figure 3 compares the results when the general conditions of the GC/MS method were followed against the GC/VUV method run with Class 2 residual solvents. Tetralin eluted at approximately 35 minutes using the GC/MS method conditions, whereas the analyte had a retention time of less than 7 minutes when the GC/VUV method was applied.
 Figure 3 – Comparison of GC/MS and fast GC/VUV method run times for residual solvent analysis in pharmaceutical products and excipients. Tetralin elutes at >30 minutes using the recommended GC/MS method conditions, whereas the fast GC/VUV method elutes it at <7 minutes
The coelution of m- and p-xylene occurred in both GC/MS and GC/VUV method runs. VUV software matched the analyte absorbance of both isomers with VUV library spectra (Figure 1) to deconvolve the overlapping signals as displayed in Figure 4. Goodness-of-fit information ensures that the correct compound assignment takes place during the post-run data analysis. Flow rate-enhanced chromatographic compression has been applied to a diverse set of applications since the development of the GC/ VUV method for residual solvents analysis.
 Figure 4 – Deconvolution of
 m
- and p
-xylene coelution. The relative contribution of each analyte is shown relative to the sum absorbance.The fast GC/VUV approach reduced GC run times for terpene analysis from 30 minutes to 9 minutes. It has also been demonstrated that GC run times as short as 14 minutes can be used for PIONA (n-paraffin, iso-paraffin, olefin, naphthene, and aromatic) compound analysis of gasoline samples. Typical GC separation times range between 1 and 2 hours using alternative methods. VUV Analyze software enables the faster GC/VUV approach by performing PIONA compound class characterization and deconvolving coeluting analytes during its automated data analysis procedure.
Compound class characterization
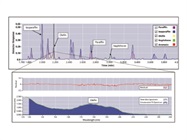
GC/VUV is well-suited for use in production settings where compound compositional analysis is desired. Because compounds share spectral shape characteristics within a class, VUV Analyze software is able to apply its fitting procedure to quickly determine the relative contribution of each compound category present in a sample. Retention index information is used to limit the amount of VUV library searching and fitting performed for each analyte, enabling analysis times of GC/VUV bulk compound characterization was first applied to the analysis of PIONA hydrocarbons in gasoline streams. The associated method eliminates the need for multiple column use and complex instrumental setup, while reducing the GC run time from 1–2 hours to approximately 34 minutes. Approved as ASTM D8071, it is suitable for use with finished gasoline, reformate, reformer feed, FCC, light naphtha, and heavy naphtha samples. A typical VUV Analyze chromatographic analysis is displayed in Figure 5. The inset shows how the analyte spectral response is fit with VUV library spectra for the selected time slice. VUV Analyze provides a report detailing the carbon number breakdown within each PIONA compound class, as well as the relative mass or volume percent of classes within the sample.
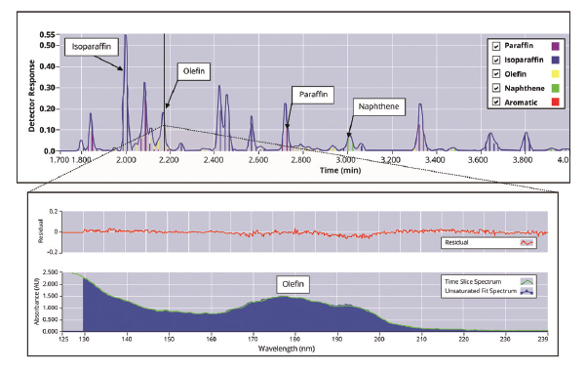 Figure 5 – Zoomed-in chromatogram of gasoline sample with key PIONA compound class representative peaks labeled. Inset shows analyte spectral features fit with VUV library olefin compound class spectral response information. The residual fit statistical data indicating a good fit is also shown.
Conclusion
As shown, VUV spectroscopy has unique capabilities that address many of the challenges inherent to GC separations. VUV light induces electronic transitions that are unique to individual compound structure; VUV spectral fingerprints are used to differentiate closely related compounds, including structural isomers. GC run times can be significantly reduced through flow rate-enhanced chromatographic compression and by resolving coelution with VUV spectral deconvolution. GC/VUV data are both qualitative and quantitative, reducing the burden of multiple detector approaches to fully characterize sample analytes. The simplicity of VUV data and the ability to automate compound class analysis results in a detector that is suitable for both R&D and production settings.
References
- Schug, K.A.; Sawicki, I. et al. Vacuum ultraviolet detector for gas chromatography. Anal. Chem. 2014, 86, 8329–35.
- Fan, H.; Smuts, J. et al. Gas chromatography–vacuum ultraviolet spectroscopy for analysis of fatty acid methyl esters. Food Chem. 2016, 194, 265–71.
- Weatherly, C.; Zhang, Y. et al. Analysis of long-chain unsaturated fatty acids by ionic liquid gas chromatography. J. Agric. Food Chem. 2016, 64, 1422–32.
- Schug, K.A. and Santos, I.C. Recent advances and applications of gas chromatography vacuum ultraviolet spectroscopy. J. Sep. Sci. 2017, 40, 138–51.
- https://www.agilent.com/cs/library/applications/5989-9726EN.pdf
Paul Johnson is senior product marketing manager, VUV Analytics, Inc., 715 Discovery Blvd., Ste. 502, Cedar Park, TX 78613, U.S.A.; tel.: 512-333-0860; e-mail: [email protected]; www.vuvanalytics.com