Featured Article

While subtle differences in polymer formulations are common, they rarely influence overall performance of the final product. However, there are instances in which a product suddenly becomes more brittle, easily deformed, or fails in routine use. When this occurs, it is important to conduct detailed analyses of the “good” and “bad” polymer, which often reveal differences in the additives, the presence of unwanted contaminants, or unexpected chemical linkages.
This article describes a technique, or method map, that guides the analyst through the maze of analytical techniques used to characterize a polymeric material, providing the most useful information about the chemical composition of samples in the least amount of time.
Pyrolysis GC/MS (PY-GC/MS)
Two samples of rubber diaphragms used in air pumps were evaluated for failure analysis. The “good” sample lasted >1200 hours before failure, while the “bad” sample lasted <800 hours before failure. Failure was defined when the diaphragm cracked and the pump ceased to function. An investigation was done to find out: Is there a difference in the chemical composition of the two samples?
To answer this question, a method mapping technique was used. The first step was to analyze the sample using evolved gas analysis (EGA). This technique provides a survey of the sample’s complexity. Using the obtained EGA thermogram as a guide, the thermal zones of interest can be analyzed one at a time using a technique called heartcutting (HC). EGA thermograms are reproducible, as are peak apex temperatures. The peak apex temperature of the polymer region for the “good” sample is 290 °C vs 298 °C for the “bad” sample. While this 8 °C difference may seem minor, it suggests that the polymers may be different, and perhaps HC could be helpful. The EGA thermograms also define the optimum pyrolysis temperature. When all the organic material has been removed from the cup, the detector response returns to baseline. In this case, 600 °C is the appropriate PY temperature to use for both samples.
Figure 1 displays the EGA thermograms of the samples showing extracted ion profiles. These EGA thermograms were obtained by heating the sample from 100 to 800 °C at 20 °C/min. The HC temperature zones are labeled for later reference when HC chromatograms are presented. Note the Y-axis differences, indicating higher abundances of materials in the “bad” sample.
Three zones were identified for HC: zone B (200–300 °C), zone D (320–350 °C), and zone F (460–520 °C). Each zone was chromatographed separately and revealed several differences in the hydrocarbon content and additives in the two samples. The subsequent use of multiple detectors, especially nitrogen-phosphorus detection (NPD) with mass spectrometry (MS), showed the presence of additional nitrogenand phosphorus-containing compounds in the “good” sample that were not present in the “bad” sample.
Figure 2 shows peaks labeled a–f detected in zones B and D. Peaks e (palmitic acid) and f (stearic acid) are detected only in zone B of the “good” sample (see yellow box). F-Search (an extensive EGA, additive, polymer, and pyrolyzate library) results for peaks a–f are shown in Figure 3. Hydrocarbons are detected in zone B of both samples, but it appears that the “bad” sample contains more hydrocarbons than the “good” sample (note the Y-axis difference). The peaks in zone F are pyrolyzates of ethylenepropylene-diene (EPDM) rubber. As the HC chromatogram of each zone shows, different compounds are detected in each zone, while there are some significant differences between zone B of both samples.
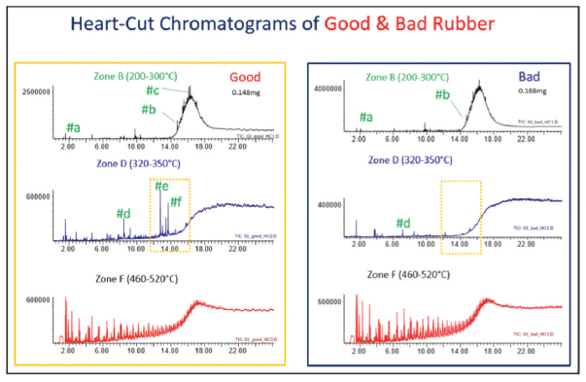 Figure 2 – HC chromatograms at three different temperature zones.
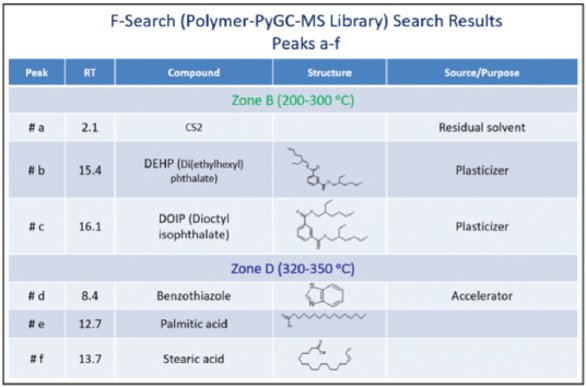 Figure 3 – Peaks a–f detected in zones B and D HC chromatograms.
Single-shot pyrolysis pyrograms were also obtained. The pyrograms revealed differences between samples, including an additional polymer in the “good” sample, chloroprene (CP) rubber, and the additive palmitic acid. Thermal desorption (TD), which is often used to search for additives present in a polymeric formulation, was also done to better study the samples. Thermally desorbed compounds are generally not degraded and are often easily identified using most MS libraries. The TD range is typically 40–320 °C. Note that in the HC chromatograms, zone B was 200–300 °C, well within the TD zone.
RxPy reactive pyrolysis (RxPy) was not used for these samples; however, if the quantitation of palmitic and stearic acid (found in the “good” rubber sample) was of interest, RxPy is a good technique to improve the peak shapes (i.e., peak area precision) of these fatty acids. RxPy is also used for the quantitation of other polymer additives as well as the analysis of natural products and condensation polymers.
PY-GC/MS can include one or all the techniques from the method map. Sample preparation is easy (cut, weigh, and analyze), and the detailed chemical composition results are invaluable when performing failure analysis, deformulation, and identification of unknown materials. F-Search libraries, which contain 700 polymers for EGA thermograms, 700 polymers for PYGC/MS, 494 additives, and 165 polymers for pyrolyzate-MS, help the analyst interpret chromatographic and spectral data. All of the techniques cited in this study provide both qualitative and quantitative information. PYGC/FID/NPD will extend the usefulness of the data to include the determination of minor components, which have heteroatoms.
Conclusion
The Multi-Shot Pyrolyzer (Frontier Laboratories Ltd., Fukushima, Japan) coupled with a GC/MS system, enables customized analysis of polymers and additives, contamination and failure, and organic and unknown composition identification. This well-engineered technology ensures reliability, reproducibility, precision, and efficiency. Applications can be found in the environmental, pharmaceutical, automotive, forensic, plasticizer, elastomer, chemical, energy, coating, fiber, ink, paper, food and flavor, and medical device industries.
Rojin Belganeh is technical and marketing director, Frontier Laboratories Ltd., 1-8-14 Saikon, Koriyama, Fukushima 963-8862, Japan; tel.: (81) 24-935-5100; e-mail: [email protected] ; www.frontier-lab.com. William Pipkin is president, ATRq, Orem, UT, U.S.A. The authors thank Robert Freeman and Itsuko Iwai (Research & Development, Frontier Laboratories) and Terry Ramus (application scientist, Diablo Analytical) for providing the analytical work, without which this article would not have been possible. Portions of this article were presented at the Gulf Coast Conference, Houston, TX, U.S.A.