Featured Article
Introduction to the exposome and pollinator decline
Researchers face an enormous challenge when it comes to understanding how genetic risk, chemical and pathogenic exposure, nutrition, epigenetic modifications, and, especially in humans, psychological and social well-being interact to influence health and disease. Over the past two decades, the scientific community has developed bioanalytical and bioinformatics techniques to address complex biological questions using ’omics approaches. Most of this work has focused on genomics (the expression of an individual’s genetic code). More recently, exposomics methodologies have been developed to characterize the environment’s contribution to health risks.
Just as genomics seeks to describe the expression of DNA, the exposome seeks to characterize the effect of environmental exposures over the course of an organism’s lifetime. Environmental exposures are organized into the external environment (air pollution, pesticide exposure, xenobiotics, etc.) and the internal chemical environment (metabolism, activity of the microbiome, oxidative stress, etc.) of the organism.1,2 Rather than viewing pre- and post-disease biological mechanisms as independent and inelastic, the exposome considers how the organism’s internal chemical environment responds to external exposures.
Exposomic characterization relies on a combination of targeted and discovery-based approaches to develop chemical profiles and associate exposure events with biological response pathways using a combination of ’omics tools—such as metabolomic workflows that use mass spectrometry—and bioinformatics software. This application note details data-collection and analysis methods used to characterize the exposome of the western honey bee (Apis mellifera) in an effort to understand the phenomenon of pollinator decline.
Since colony collapse disorder was reported in 2006,3 environmental factors involved in pollinator decline have been explored extensively using both experimental and correlational approaches. Xenobiotics (chemical exposures foreign to the biological system) have been scrutinized, as have the fungal gut parasite Nosema apis and its close relative Nosema cerane. Recent studies suggest that susceptibility to the microsporidian gut pathogen Nosema ceranae is significantly increased when bees are also exposed to fungicides.3
These well-designed experiments exploring one or two environmental impacts on disease have certainly lent themselves to a deeper understanding of the environmental causes of pollinator decline. However, little is understood about the mechanisms behind such results, and even less is understood about how these observations change outside the controlled laboratory setting. Using gas chromatography/quadrupole time-of-flight mass spectrometry (GC/QTOF) for discovery-based exposome profiling, and semiquantitative PCR targeted disease screening, the paradigm described here sheds light on potentially unexplored mechanisms of infection, biochemical feedback, and increased susceptibility to disease.
The disease and exposome workflow
When applying the exposome paradigm, researchers collect as much chemical information in a biological system as possible in a case (positive disease)/control (negative disease) type of investigation. As a proof-ofconcept, this study examined the exposomes of honey bee samples from 30 unique hives in seven geographic locations and performed and integrated these data with hives determined to be infected with N. ceranae compared to uninfected hives.
Semiquantitative polymerase chain reaction (sqPCR) screening for the common gut fungal pathogen Nosema ceranae and apis was used to assess the disease state of the hives. A total of 6 mL of RNase-free water was added to 30 bees collected from each hive. The bees were homogenized with a sterile mortar and pestle. DNA was extracted from a 150-µL aliquot using a phenol:chloroform:isoamyl alcohol (25:24:1 v/v) mixture. PCR was performed according to an adaptation of standard screening methods4 targeting N. apis and N. ceranae in duplex PCR reactions that included a reference gene to permit semiquantitation of 3% electrophoresis gels. Hive samples were run in triplicate and the ratios of each Nosema species to reference gene were averaged. Hive infection was considered as a categorical variable: infected (N. ceranae ratio >0, n = 18) or uninfected (N. ceranae ratio = 0, n = 12). No N. apis was detected. If desired, the semiquantitative ratios can be examined as a measure of parasite load (a continuous variable).
Samples from each hive were also collected for GC/QTOF analysis. Each sample was extracted using previously published methods.5 Briefly, the extraction includes: pulverizing 3 g of bees in 27 mL of water:acetonitrile:acetic acid (44%:55%:1%). The samples were extracted via QuEChERS extraction (Agilent Technologies, Santa Clara, CA) with the addition 6 g of magnesium sulfate and 1.5 g sodium acetate. The extraction tubes were sealed, shaken, and centrifuged at 3000 rpm for 5 min. Two milliliters of the supernatant was applied to a conditioned solid-phase extraction (SPE) cartridge (Agilent Technologies). Analytes were eluted from the SPE cartridge with acetone/toluene (7:3 v/v).
An Agilent 7890B/7200B GC/QTOF system was used to collect exposome profiles of each sample. Briefly, the method parameters were: a 0.2-µL pulsed splitless injection was made into a 250 °C isothermal split/splitless inlet. The GC was configured with a 40 m × 0.25 mm × 0.25 µm DB5-MS DuraGuard column (J&W 122-5532G) operated at 1.2 mL/min helium in constant flow mode. The oven program was 80 °C (1 min) and then 10 °C/min to 310 °C (6 min). Transfer line temperature was 300 °C. The mass spectrometer was operated in electron ionization, high-resolution TOF mode. The source and quadrupole (RF only) temperatures were 275 °C and 150 °C, respectively. High-resolution, accurate mass (HRAM) spectral data were collected at 5 Hz over a mass range of 50 Da to 800 Da. Automated intrasequence mass calibration was performed immediately prior to each sample injection. The 30 samples were run in duplicate, and the average of the two runs was used for data analysis.
Raw data acquired on the GC/QTOF system were analyzed using the Agilent MassHunter suite of software for chemical feature extraction; chemical identification via screening against known commercial spectral libraries; and covariate, statistical analysis. Statistical associations were made between chemical profiles of N. ceranae infected and uninfected samples using Agilent MassProfiler Professional (MPP) bioinformatics software. Chemical features associated with infection were determined through ANOVA statistical testing. Using Agilent Pathway Architect tools in the MPP environment, statistically significant chemicals and metabolites were screened against known Apis mellifera biological pathways downloaded from the Kyoto Encyclopedia of Genes and Genomes (KEGG) database (Figure 1).
 Figure 1 – Overview of exposome workflow in a stepwise fashion. From top to bottom: Honey bee foragers were sampled from 30 hives for two separate data collection techniques: targeted sqPCR and discovery-based GC/TOF. Overlaid chromatographs from 30 hives as exposome output from the GC/TOF and a representative
 Nosema
gel electrophoresis from sqPCR are shown. Exposome data were annotated using the MassHunter suite, and the two datasets were combined for statistical analysis in MPP. An unsupervised hierarchical cluster of 10 exposome profiles from 10 different hives are one representation of how the datasets can be integrated. Infected and uninfected hives were compared to assess the difference in the xenobiotic exposure events through a chi-squared test, and one example is shown where the relative metabolite abundance of succinate was mapped onto highly conserved metabolic pathways using the KEGG database.Insights generated by the workflow
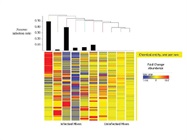
More than 2350 chemical features were identified in the MS data, and the spectral library searches successfully annotated 73% of these compounds (≥60% match factor score). When the exposome profiles are grouped based on unsupervised hierarchical clustering, exposome profiles associated with disease load are observed. These observations support the authors’ hypothesis that chemicals and metabolites unique to the presence of a Nosema infection can be identified and possibly serve as chemical biomarkers for the presence of this disease (Figure 2).
 Figure 2 – Unsupervised hierarchical clustering heat map of exposome profiles from bee hives. More similar exposome profile signatures are grouped next to one another; less similar ones can be found further away from one another on the tree. Red indicates a relatively higher chemical abundance, while blue and gray indicate a relatively lower abundance. Yellow indicates a neutral change from the overall average abundance found across all 30 hives. Each row represents one chemical entity, with rows at the top having an overall higher level of perturbation across the exposomes; chemical entity names to the right of the heat map are not shown for clarity. This heat map was developed by MPP.
 Nosema
infection ratios were then overlaid on the heat map to examine biomarker signature profile differences between infected and uninfected hives. Infected and uninfected hives have more similar exposome signatures and are therefore grouped together. Overall, there is more perturbation of the exposome in infected bee hives.Twenty xenobiotics were identified in the bee samples, and it was determined that the total number of xenobiotics exposure events were significantly higher in N. ceranae infected bee hives (χ2 = 7.619, df = 1, n = 30, p<0.006). These data provide insights into possible associations between Nosema infection and xenobiotic exposures, and are consistent with a model where even a minor disruption in key metabolic pathways from any sublethal exposure(s) may increase susceptibility to disease. Moreover, many of the identified pathways found in the KEGG analysis differed from previous pathways identified by transcriptomic and proteomic studies,6,7 suggesting that exposomics has the potential to complement the findings of other ’omics studies.
The advantages of using this workflow and integrating the two datasets are fourfold: 1) unknown chemical entities can be accounted for with the discovery-based exposome analysis, 2) novel stressors and new interactions among previously identified stressors can be measured and quantified, 3) new chemical biomarkers of disease can be identified to create a chemical signature profile that can increase accuracy of predicting bee health decline, and 4) KEGG pathways analyses can lead to a better mechanistic understanding of how multiple stressors interact. These new insights may explain how synergistic declines in bee health occur.
References
- Wild, C.P. Complementing the genome with an “exposome”: the outstanding challenge of environmental exposure measurement in molecular epidemiology. Cancer Epidemiol. Biomarkers Prev. Aug 2005, 14(8), 1847–50; doi:10.1158/1055-9965.epi-05-0456.
- Rappaport, S.M. and Smith, M.T. Epidemiology. Environment and disease risks. Science Oct 2010, 330(6003), 460–1; doi:10.1126/science.1192603.
- Goulson, D.; Nicholls, E. et al. Bee declines driven by combined stress from parasites, pesticides, and lack of flowers. Science Mar 2015, 347(6229); doi:10.1126/science.1255957.
- Hamiduzzaman, M.M.; Guzman-Novoa, E. et al. A multiplex PCR assay to diagnose and quantify Nosema infections in honey bees (Apis mellifera). J. Invertebr. Pathol. Oct 2010, 105(2), 151–5.
- Mullin, C.A.; Frazier, M. et al. High levels of miticides and agrochemicals in North American apiaries: implications for honey bee health. Plos One Mar 2010, 5, 19; doi:10.1371/journal.pone.0009754 (2010).
- Vidau, C.; Panek, J. et al. Differential proteomic analysis of midguts from Nosema ceranae-infected honeybees reveals manipulation of key host functions. J. Invertebr. Pathol. Sept 2014, 121, 89–96; doi:10.1016/j.jip.2014.07.002.
- Kurze, C.; Dosselli, R. et al. Differential proteomics reveals novel insights into Nosema-honey bee interactions. Insect Biochem. Mol. Biol. Dec 2016, 79, 42–9; doi:10.1016/j.ibmb.2016.10.00.
Sassicaia J. Schick is with the Department of Biology, Swarthmore College, Swarthmore, PA, U.S.A. Robert L. Broadrup and Helen K. White are with the Department of Chemistry, Haverford College, Haverford, PA. Christopher Mayack is with the Department of Biology, Swarthmore College; and Molecular Biology, Genetics, and Bioengineering, Faculty of Engineering and Natural Sciences, Sabancı University, Istanbul, Turkey. Anthony Macherone is with the Department of Biological Chemistry, The Johns Hopkins University School of Medicine, Baltimore, MD, U.S.A., and the Life Science and Chemical Analysis Group, Agilent Technologies, 2850 Centerville Rd., Santa Clara, CA 95051, U.S.A.; tel.: 302-636-8159; e-mail: [email protected]; www.agilent.com