Featured Article
One of the most common needs among protein scientists is particle characterization. As such, imaging data is one of the accepted techniques for acquiring size, shape, and other morphological information used to differentiate protein aggregates from other particles in the formulation. Flow imaging microscopy provides a wide range of particle size detection from 2 micrometers up to 5 millimeters, and reveals morphological characteristics of the particles imaged. It can detect translucent, semitranslucent, and opaque particles, and allows for the differentiation of protein aggregates and nonproteinaceous particles.
Oil immersion flow microscopy has recently become available, with a unique capability to image nanoparticles by increasing optical resolution down to the hundreds of nanometers, thus increasing the range of particle detection down to 300 nanometers. This technology has been termed Nano-Flow Imaging (Fluid Imaging Technologies, Scarborough, ME).
The Abbe resolution limit1 defines the smallest detail that an optical system can resolve. In a perfect optical system using a particular wavelength of light and having a certain numerical aperture, this limit is defined by the equation: resolution = 0.61*wavelength/(numerical aperture). For a typical high-quality 10× air objective microscope, this is approximately 2 µm. However, in microscopy, it is possible to realize much better resolution if oil immersion objectives are used in combination with a blue light-emitting diode (LED). A typical high-quality oil objective in the same system can have a numerical aperture of 1.4, resulting in a resolution = 0.61*0.5 (µm)/1.4 or 0.22 µm. This means that the resolution is approximately 10 times better with oil immersion optics. It also means that the system can be used for nanoparticle analysis.
Applications of oil immersion microscopy to flow imaging
Oil immersion objectives are designed to work with high-numerical aperture Abbe condensers to provide optimum illumination. In addition, they are designed to image the specimen through immersion oil and a coverslip. The optimal configuration has a glass slide under the specimen with immersion oil between the slide and the condenser (Figure 1). This image shows the optimal flow imaging configuration when there is a glass slide under the specimen with immersion oil between the slide and the condenser. It is possible to install a flow cell into an imaging flow cytometer in a similar fashion to realize a high-resolution imaging system (Figure 2).
 Figure 1 – Front view of typical oil immersion microscope sample assembly.
 Figure 2 – Top view of the FlowCam Nano oil immersion flow cell assembly (Fluid Imaging Technologies).
In this novel configuration, which was awarded a patent,2 the coverslip and microscope slide are replaced by the walls of the flow cell.
Oil immersion flow microscopy reveals protein agglomerates; silicon oil droplets; glass shards; and other opaque, transparent, and translucent subvisible particles with the high-resolution imagery needed for identification. The real advantage of this technology is the ability to image and identify, in real time, particulate content in a fluid where the morphology of the particles is critical to their characterization. Technology for the detection and imaging of nanoparticles has evolved significantly in recent years due to the heightened awareness and significance of nanoparticles. This system is an important step forward, with its ability to image and characterize nanoparticles in real time.
The Nano-Flow Imaging system provides the submicron images necessary to provide an early warning system of colloidal activity and its origins (protein or silicon oil). The images are invaluable in the identification of the origins of protein aggregation.
In applications beyond protein formulation— for example, in food, beverage, and biological treatment processes—the technology allows the operator to characterize microorganism populations (bacteria too small to otherwise be monitored without microscopy) while providing statistically significant data. The Nano-Flow Imaging system enables the user to image nanoparticles and nanoparticle-sized details on larger particles in flow.
Importance of selecting illumination wavelength
As can be seen from the equation defining the Abbe resolution limit (resolution = 0.61*wavelength/(numerical aperture), resolution is directly proportional to the illumination wavelength. A white light source will have a range of wavelengths including red, blue, and green. Red offers the lowest resolution, green offers medium resolution, and blue provides the highest. In this way, a white light source with a combination of wavelengths would smear out the image and decrease the resolving ability. A short wavelength light source such as a 0.408-µm blue LED will allow for better resolution. Using this value, the resolution with a 1.4-numerical aperture objective will give a resolution of 0.22 µm. This wavelength was thus chosen for illumination.
Methods
An oil immersion Nano-Flow Imaging system was configured with a 1.4-NA oil immersion objective. Fisher Scientific size calibration polystyrene beads of 345, 602, and 903 nm (Fisher Scientific P/N 3K-350, 3K-600, and 3K-900, respectively) were added to 50-µL samples of deionized water and drawn into the instrument using the VisualSpreadsheet software (Fluid Imaging Technologies). The instrument was calibrated by sizing these beads and adjusting the calibration constant of the instrument. An edge gradient filter was used to isolate and eliminate beads that were not in focus. Once the instrument was calibrated, the beads were processed again with the instrument. Protein agglomerate samples and NIST protein samples were similarly processed with the oil immersion Nano-Flow Imaging system. For comparison purposes, NIST protein samples were also processed on a 10× air objective flow imaging system.
Results
The 345-, 602-, and 903-nm beads measured 350, 590, and 950 nm, respectively. Bead size data show a measurement error of less than 10%. Once the instrument was properly calibrated, NIST Protein Reference Standards were run.
In the protein agglomerate images (Figure 3), the features down to approximately 0.3 µm are clearly visible. In the case of large particles, it can be seen that portions of the particle may be out of focus.
 Figure 3 – Protein agglomerates from NIST Protein Reference Standards (bar = 10 µm).
The NIST images (Figure 4) were acquired with the air-based 10× system. With this configuration, it is not possible to detect or image the particles under 1 µm, nor is it possible to discern great detail of the larger 5–6 µm sized particles. The images shown in Figure 5, taken with the oil immersion Nano-Flow Imaging system, range in size from 300 nm to almost 6 µm in size. These images display much higher resolution and greater detail.
 Figure 4 – NIST Protein Reference Standards as imaged with a standard 10× air objective flow imaging system. (Particle size shown below each image in microns ranging from 1–6 µm.)
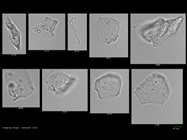
 Figure 5 – NIST Protein Reference Standards as imaged with 40× oil immersion Nano-Flow Imaging system. (Particle size shown below each image in microns ranging in size from 300 nm to almost 6 µm.)
To demonstrate the difference in the resolving power of the oil immersion Nano-Flow Imaging system to the standard air objective flow imaging system, the 6-µm particle in Figure 4 should be compared to the 5.97-µm particle shown in Figure 5.
Summary
For the first time in the history of formulation analysis technologies, an imaging flow microscope with properly configured oil immersion optics can be used to analyze samples with particles down to about 300 nm. This opens a new world of feedback to formulation scientists and process technicians. Contaminants can be introduced anywhere in production, and can lead to problems ranging from recalls to serious complications and death. Having an image of a mystery nanoparticle shows scientists where to look for improvements: formulation development, quality assurance, fill finish, or storage and transportation.
References
- Born, M. and Wolf, E. Principles of Optics, sixth ed. Pergamon Press: New York, NY: 1993, p. 419.
- Sieracki, C.K. and Peterson, K.A. Oil-immersion enhanced imaging flow cytometer. U.S. Patent 7,796,256 b1; May 5, 2008.
Chris Sieracki is chairman at Fluid Imaging Technologies, 200 Enterprise Dr., Scarborough, ME 04074, U.S.A.; tel.: 207-289-3200; e-mail: [email protected] ; www.fluidimaging.com