Featured Article
Diffuse reflection infrared Fourier transform spectroscopy (DRIFTS) was first demonstrated by Fuller and Griffiths in 1978,1 and has since become an important spectroscopic tool for characterizing powders and rough surfaces. Soon after its introduction, researchers strived to optimize DRIFTS optical systems to improve performance.2-6 Those efforts yielded DRIFTS accessories that install in the sample compartments of commercial FTIR instruments, making the technique widely available. One of these DRIFTS accessories incorporates two ellipsoid mirrors oriented in a “praying mantis” configuration.7 This optical configuration purportedly offers an acceptable compromise between collection of diffusely reflected radiation and rejection of the specular reflection component. Because of the substantial loss in optical efficiency when DRIFTS accessories are installed in host FTIRs, measurement sensitivity and detection limit are significantly degraded. This can be problematic when monitoring variations in low-absorbing sample spectrum features. Therefore, decisions to employ DRIFTS or to use the technique in conjunction with sealed sample holder chambers should be based on signal-to-noise ratio (SNR) considerations. This paper describes the impact of typical DRIFTS optical configurations on measurement SNR for the praying mantis optical layout.
Experimental
A Nova Cygni 120 FTIR (Thermo Mattson, Madison, WI) and a Praying Mantis diffuse reflection accessory equipped with an HVC-DRP environmental chamber (Harrick Scientific Inc., Pleasantville, NY) were used for measurements. Davisil silica gel (75–150 μm particles) was purchased from Sigma-Aldrich (St. Louis, MO). Potassium bromide powder was prepared by crushing pieces of KBr window material. This powdered KBr was sieved to obtain a 40–150 μm particle size range. The FTIR was equipped with a 1 mm × 1 mm liquid nitrogen-cooled mercury-cadmium-telluride (MCT) detector. After installing the Praying Mantis diffuse reflection accessory into the FTIR, its mirrors were aligned by placing a manufacturer-supplied 30.75° tilted plane mirror at the sample focal point and then adjusting the four accessory plane mirrors to achieve the maximum interferogram signal.
After optimization, the interferogram zero-path difference (ZPD) signal was about 10% lower than the host FTIR open-path detector voltage, which is consistent with reflection losses from the six accessory and one alignment mirror surfaces. An infrared phosphor card was used to view the infrared beam image at focal points. For the FTIR open-path configuration (i.e., without diffuse reflection optics), beam diameters at the sample focus and detector were about 15 and 5 mm, respectively. The beam diameter was about 4 mm at the diffuse reflection sample focal point and about 5 mm at the detector when the alignment mirror was installed. When the sample holder was filled with KBr powder, the beam diameter at the detector increased to about 10 mm in diameter. The optimum diffuse reflectance sample position was found by filling the sample holder (4.8 mm diameter) with silica gel powder and then adjusting the sample height to achieve the maximum interferogram ZPD voltage8 while still maintaining the single-beam spectrum representative of this highly absorbing sample. By following this procedure, the collection of radiation that had penetrated silica gel particles was maximized while minimizing detection of Fresnel surface reflected radiation.
The silica gel powder was then removed and replaced with KBr powder. Sample powders were loaded without compression, and the top surface was leveled by scraping with the edge of a spatula. Single-beam spectra were measured at 2, 4, and 8 cm-1 resolution by signal averaging 100 interferogram scans. For each optical configuration and resolution, 26 single-beam spectra were successively acquired. The first single-beam spectrum was designated as the background for each of the subsequent measurements. By calculating the ratios of the sample single-beam spectra to the background single-beam spectrum, 25 reflectance spectra representing baselines were generated. The reflectance spectrum noise was defined as the root-mean-square (RMS) value between 1800 and 2200 cm-1 calculated after removing the best-fit straight line through the data points. Maximum SNR was calculated by dividing the largest possible change in reflectance (i.e., for a band extending from R = 1 to R = 0, |ΔR|=1) by the RMS noise. Reported maximum SNR values are averages of the 25 reflectance spectrum measurements.
Results and discussion
Figure 1 shows an overlay of single-beam spectra obtained with different FTIR optical configurations. The plot labeled “Open Path” denotes the host FTIR single-beam spectrum, and the other spectra represent KBr powder DRIFTS spectra obtained with the diffuse reflection (DR) optics, after addition of the diffuse reflection sample holder chamber without windows {DR + Chamber (Open)}, the chamber with KBr windows installed {DR + Chamber (KBr)}, and the chamber with ZnSe windows installed {DR + Chamber (ZnSe)}. The maximum single-beam intensity was found at about 1450 cm-1 in all spectra. The normalized single-beam intensity decreased by a factor of about five (to about 0.22 at 1450 cm-1) when the diffuse reflection optics were installed. Considering that these DR optics collect at most 20% of reflected radiation, this DRIFTS single-beam maximum intensity is greater than expected. This finding was likely due to MCT detector signal nonlinearity, which would be greatest for the open-path measurement.9 In addition, visual examination of the images at the detector focus indicated that size, shape, and intensity distributions were different for the FTIR open path and DR optical configurations. Because the detector area was significantly smaller than the beam image for both FTIR optical configurations, only a fraction of the total infrared radiation contributed to detector signal. Consequently, detector image intensity variations may have also contributed to the higher-than-expected diffuse reflection single-beam spectrum measurement.
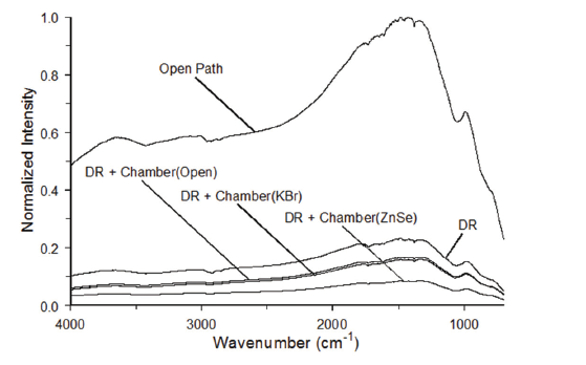 Figure 1 – Single-beam spectra (8 cm-1 resolution) obtained for different DRIFTS optical configurations.
Adding the sample holder chamber without windows reduced optical throughput, resulting in a normalized maximum single-beam intensity of about 0.16. Installing the windows in the chamber caused the 1450 cm-1 intensity to drop to 0.15 (KBr) and 0.08 (ZnSe). The impact of diminishing optical efficiency on maximum reflectance spectrum SNR is shown in Figure 2. The highest SNR (21,200) was obtained when the FTIR was operated at 8 cm-1 resolution without the diffuse reflection optics. The lowest SNR (994) was obtained at 2 cm-1 resolution when the diffuse reflection sealed sample holder chamber contained ZnSe windows. Compared to results obtained with the DR optics (i.e., without the chamber), adding the chamber reduced DRIFTS spectral SNR by about 25%. The corresponding SNR decrease was 35% when the chamber contained KBr windows, whereas the chamber with ZnSe windows yielded a 64% SNR reduction.
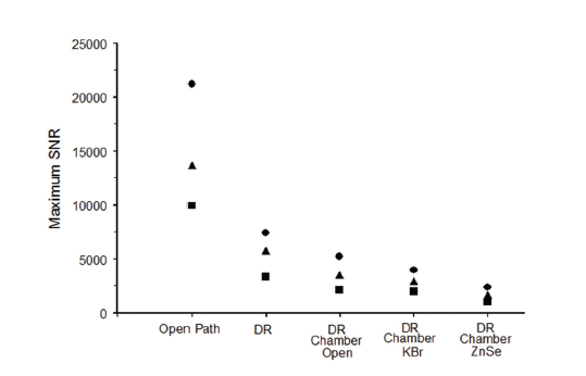 Figure 2 – DRIFTS maximum SNR dependence on optical configuration for different measurement resolutions (circle = 8 cm-1, triangle = 4 cm-1, square = 2 cm-1).
The trends in Figure 2 are consistent with predictions from the FTIR SNR equation,10,11 which predicts lower values when optical efficiency decreases and higher values at lower measurement resolutions for the same optical arrangement:
 .
.
This equation indicates that FTIR SNR is a function of measurement time (tm), spectral resolution (Δν¯), infrared source radiance {B(ν¯)}, detector response function {D(ν¯)}, and optical efficiency (E). With the same FTIR moving mirror and data acquisition parameters, when spectral measurement resolution is increased by a factor of 2, tm doubles and Δν¯ decreases by a factor of 2. Therefore, measurement SNR, which is proportional to √tm Δν¯, is expected to decrease by about 30%. Plots of SNR as a function of single-beam intensity for each of the spectral resolutions employed for measurements were approximately linear. Best-fit line slopes increased with increasing wavenumber spacing (i.e., lower spectral resolution) in a manner consistent with the √tm Δν¯ dependence predicted by the SNR equation.
The dependence of DRIFTS SNR on optical efficiency and measurement resolution follows predictions based on the generalized SNR equation.10 Optical efficiency was reduced after incorporating the Praying Mantis accessory into the host FTIR because of mirror reflection losses and the inability to collect all of the radiation scattered by the sample. Adding the sample holder chamber reduced the solid angles for the sample incident beam and for the collected radiation, resulting in decreased intensity at the detector. Transmittance through the sealed chamber windows is primarily determined by Fresnel reflection losses rather than window material absorbance. The addition of KBr windows to the chamber decreased SNR by 8% relative to the open chamber. In contrast, the use of ZnSe windows resulted in a much greater (37%) SNR reduction.
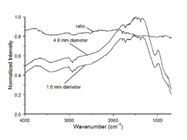
Because the DR beam diameter at the infrared radiation detection focal point exceeded the size of the MCT detector, different portions of the sample surface were unequally represented by measured spectra. To further investigate this phenomenon, a mask was placed over a KBr powder sample surface to restrict infrared radiation exposure and diffuse reflection to a 1/16-in. (1.6-mm) diameter opening at the center of the sample holder. The DR optics were aligned by maximizing the detector signal with this mask in place. The single-beam spectra shown in Figure 3 were measured with the mask in place and after removing the mask to expose the entire sample to infrared radiation. As indicated by the dashed line representing the ratio of these single-beam spectra, over 80% of the detector signal could be attributed to the center of the sample holder. The area of the sample exposed with the mask in place was about six times less than the sample area illuminated without the mask. If the diffusely scattered radiation from the entire sample had been detected, the single-beam spectrum intensity would have increased by a factor of ~6 rather than the observed factor of ~1.25 when the mask was removed.
 Figure 3 – Single-beam spectra (8 cm-1 resolution) obtained with 1/16-in. (1.6-mm) and 3/16-in. (4.8-mm) diameter powdered KBr sample surfaces exposed to radiation. The dashed line represents the ratio of the two single-beam spectra.
Conclusion
Although measurements reported here pertain to the host FTIR and DR optics employed for this study, similar SNR trends should be representative of other optical systems incorporating DRIFTS accessories. Optical efficiency and measurement resolution are the two primary factors that dictate DRIFTS spectrum SNR for a given sample. Because SNR decreases with increasing resolution, the host FTIR should be operated at the lowest resolution that maintains the integrity of sample spectral features.12
For best performance, the infrared beam solid angle at the detector should be consistent with the FTIR detector field of view.2,13 For the optical system employed here (and typical commercially available instruments), the detector surface area is smaller than the focused infrared image. Because the diffuse reflection detector beam diameter depends on the scattering properties of the sample, the optimum detector area will be sample dependent. Unfortunately, due to inconvenience and expense, it is typically not practical to match the diffuse reflection beam diameter to the detector surface area. Thus, diffuse reflection spectral SNR will be heavily dependent on the optical layout and detector dimensions of the host FTIR. Due to the mismatch between the infrared beam and detector areas, different sample locations are disproportionately represented in measured spectra. As a result, absorber concentration variations throughout solid samples could be detrimental to quantitative measurements.
Sealed sample holder chambers can significantly reduce optical efficiency and should be used only when sample environments must be carefully controlled. ZnSe chamber windows are preferred when samples evolve water, which can fog KBr windows. However, because of large Fresnel surface reflection losses, ZnSe chamber windows should be used only when necessary.
References
- Fuller, M.P. and Griffiths, P.R. Anal. Chem. 1978, 50, 1906–10.
- Hirschfeld, T. Appl. Spectrosc. 1986, 40, 1082–5.
- Brimmer P.J. and Griffiths, P.R. Appl. Spectrosc. 1987, 41, 791–7.
- Brimmer P.J. and Griffiths, P.R. Appl. Spectrosc. 1988, 42, 242–7.
- Brimmer P.J. et al. Appl. Spectrosc. 1986, 40, 258–65.
- Korte, E.H. Appl. Spectrosc. 1988, 42, 428–33.
- Milosevic M. and Berets, S.L. Appl. Spectrosc. Rev. 37, 2002, 347–64.
- Moradi, K. et al. Appl. Spectrosc. 1994, 48, 1491–7.
- Richardson, R.L. et al. Appl. Spectrosc. 1998, 52, 572–8.
- Mattson, D.R. Appl. Spectrosc. 1978, 32, 335–8.
The authors are with the Department of Chemistry and Biochemistry, University of Oklahoma, 101 Stephenson
Pkwy., SLSRC, Room 1000, Norman, OK 73019-5251, U.S.A.; tel.: 405-325-4811; e-mail: [email protected];
www.ou.edu