Featured Article
Understanding a material’s structure–property relationship is necessary when designing, processing, and using a product. A range of thermal analysis techniques measure the physical properties of a material with respect to temperature, time, and atmosphere. The most prevalent thermal analysis technique—differential scanning calorimetry (DSC)—measures endothermic and exothermic processes in materials and is widely used to characterize a broad range of materials including polymers, pharmaceuticals, foods, biologicals, organic chemicals, and inorganic materials. Thermal events measured include the glass transition (Tg), melting, crystallization, cure reactions, onset of oxidation, and heats of transitions (enthalpy). DSC data can be utilized to go beyond the measurement of temperature and enthalpy to determine reaction kinetics, specific heat capacity, compatibility and stability of blends and alloys, effect of aging, impact of additives on crystallization, and much more. Several ASTM and ISO standards are written around the characterization of materials with DSC.
There are two fundamental designs of DSC—power compensated and heat flux. Heat flux is by far the most common design used by DSC manufacturers because of its stable baselines and sample chamber robustness and durability.1 Power compensation DSC is used primarily when fast heating and cooling rates are required.1
Power compensation DSC consists of two small, separate furnaces that are controlled independently by a defined heating program. If a material undergoes an exothermic or endothermic event, there will be a temperature difference between the furnaces. Power is then applied to or removed from the sample furnace to compensate for the energy change within the sample. Ideally, the system should be maintained in a thermally null state at all times. The difference in thermal power (ΔP) is the change in the heat flux.1
Heat flux DSC consists of a single furnace in which the specimen and reference material are heated or cooled together under a controlled temperature program. The reference and sample sensors are connected by a low-resistance heat flow path (thermoelectric disk) (Figure 1). The sample is encapsulated in a pan (typically aluminum) and, along with an empty reference pan, sits on a thermoelectric disk surrounded by a furnace. As the furnace temperature is changed, typically at a constant rate, heat is transferred to the sample and reference through the thermoelectric disk. The differential heat flow to the sample and reference is measured by area thermocouples using the thermal equivalent of Ohm’s law.
 Figure 1 – Heat flux DSC (TA Instruments, New Castle, DE).
The equation for heat flow is:
q = ΔT/R
(1)
where: q = sample heat flow, ΔT = temperature difference between the sample and reference, and R = resistance of the thermoelectric disk.
As long as the sample and reference respond to the temperature program in the same way, the heat flux remains constant. As the sample undergoes an endothermic or exothermic transition or event, a temperature difference is recorded by the DSC and is used to generate the DSC thermogram (Figures 2 and 3).
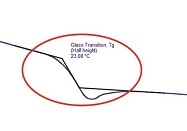
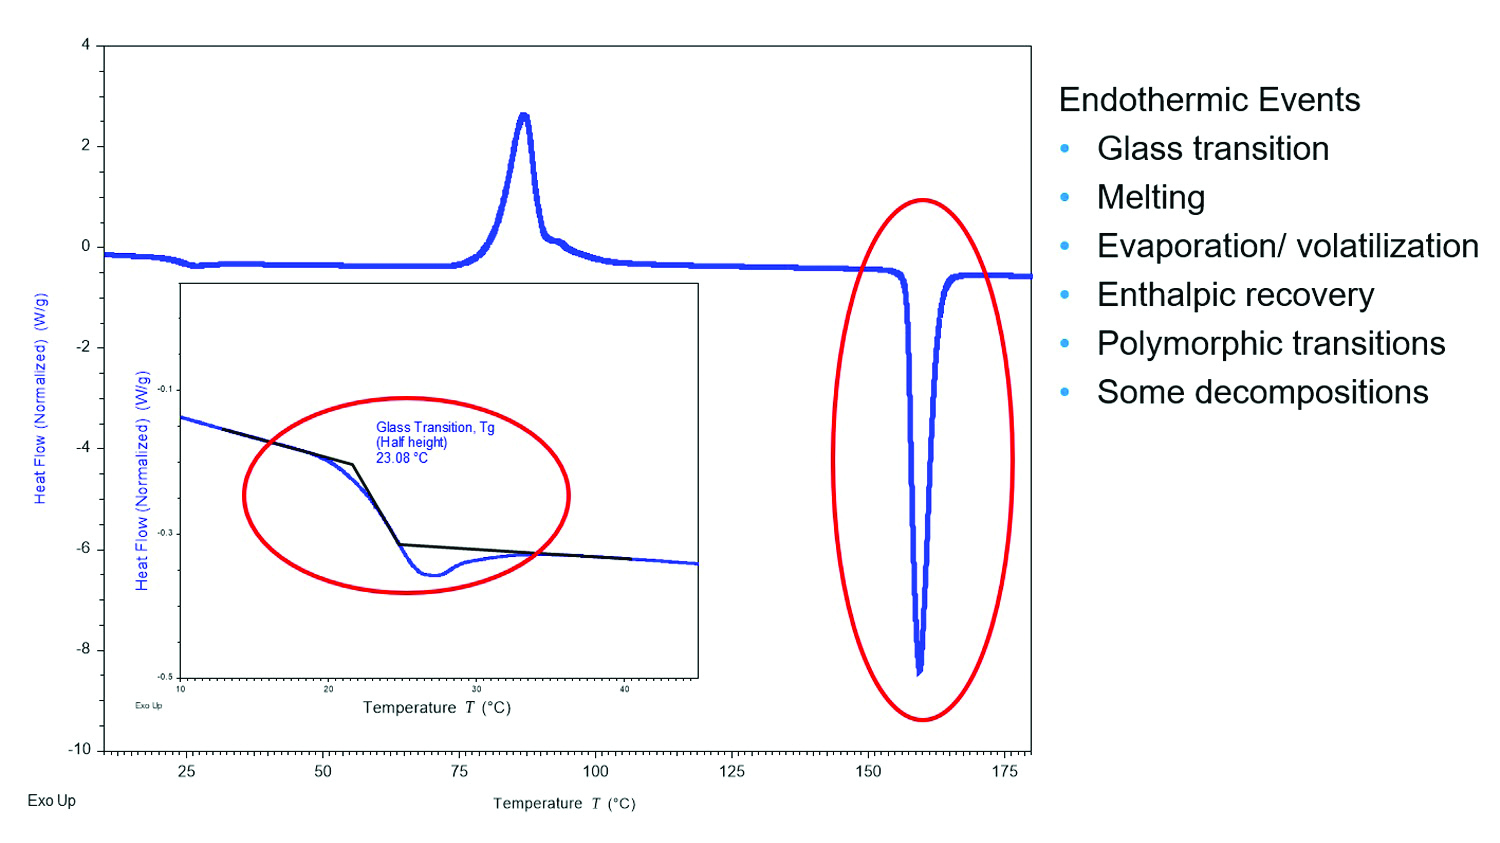 Figure 2 – DSC thermogram highlighting endothermic transitions.
Making a better measurement
The simplified one-term equation (Eq. [1]) does not account for the heat flows into and out of the sensor and sample pan and the imbalances within the cell design. The results achieved by this relationship, although good, are not optimized with regard to baseline flatness. It is important to note that all DSC manufacturers use this same one-term equation with its inherent limitations. To use this relationship, many assumptions are made regarding the symmetry between the sample and reference sides of the cell that require impossibly precise manufacturing techniques. As a result, the baseline curvature and drift may be significant enough that it can mask or skew the detection of a thermal event in a material.
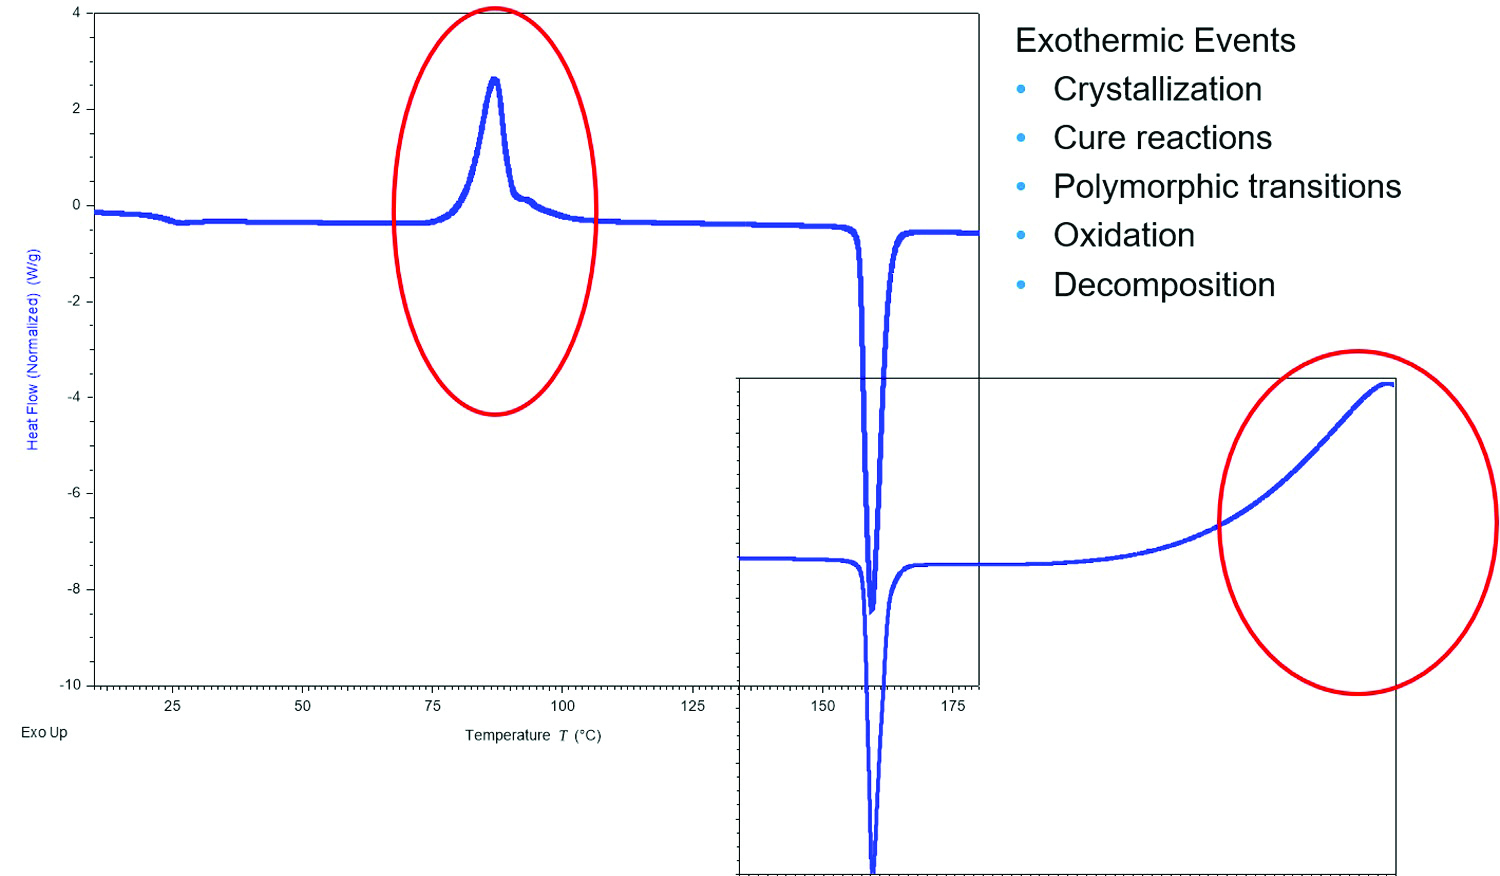 Figure 3 – DSC thermogram highlighting exothermic transitions.
Tzero Technology from TA Instruments is specifically designed through hardware (Figure 1) and software (Eq. [2]) to account for these extraneous heat flows and offers a more accurate representation of the heat flow into and out of the sample (U.S. Patents 6,431,747; 6,488,406; and 6,561,692). The expanded heat flow expression that describes this cell design and the resultant instrument baseline performance is outlined in the Tzero equation (Eq. [2]) and Figure 4.
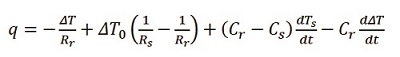
(2)
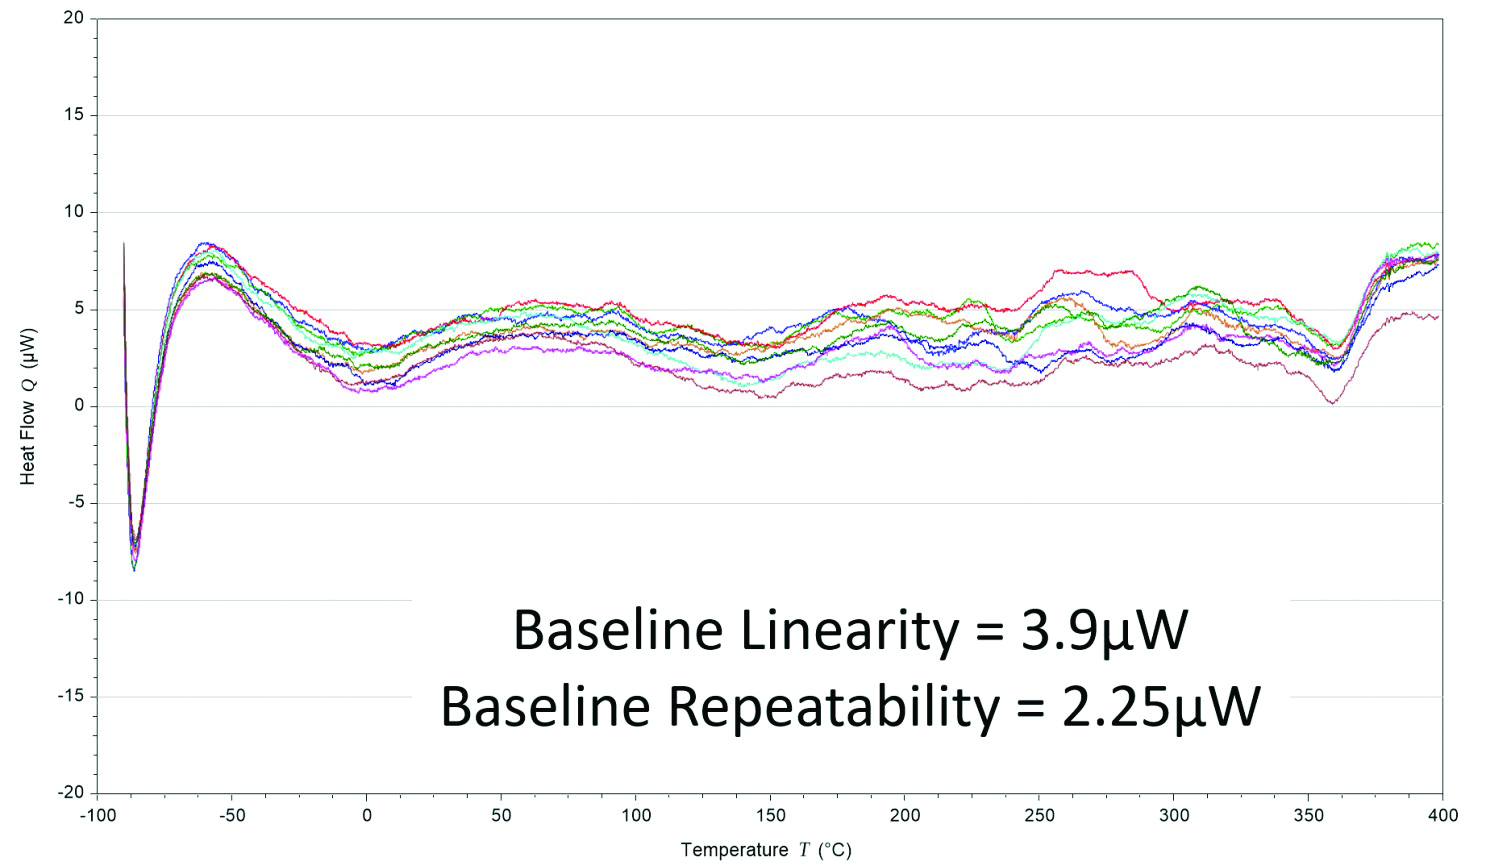 Figure 4 – The resultant Tzero Technology DSC baseline performance (an overlay of 10 individual experiments).
The first term in this heat flow expression is the equivalent of the conventional single-term DSC heat flow expression. The second and third terms account for differences between the sample and reference thermal resistances (Rs, Rr) and capacitances (Cs, Cr), respectively. These terms reflect imbalances in the instrument that are the primary source of instrument baseline deviations and have the biggest impact where the sample heat capacity is the predominant contributor to the heat flow. The fourth term accounts for the heating rate difference between the sample and reference pans and has the most impact during enthalpic events such as melting. Rather than assume cell symmetry, which is required when using the conventional one-term heat flow equation, Tzero Technology incorporates a fundamentally more accurate four-term heat flow equation and provides a way to model each individual DSC cell without assumptions.2,3
These design features benefit a DSC measurement by: 1) accurately determining specific heat capacity; 2) providing improved sensitivity in the detection of weak thermal events and transitions (such as the glass transitions of highly filled, crosslinked thermosets or highly crystalline materials) and earlier detection of the onset of reactions (crystallization, melting, cure) for more accurate enthalpy and kinetics; and 3) delivering improved resolution for higher peaks, sharper onsets, and a faster return to baseline.
Considerations when using DSC
A material’s response in a DSC is best defined by Eq. (3). The amplitude of heat flow is the sum total of a heat capacity component and kinetic component of the test material. Understanding this equation can help a researcher optimize the experimental conditions for testing a material.
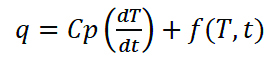
(3)
where: q = sample heat flow, Cp = sample heat capacity, dT/dt = heating rate, and f(T,t) = kinetic response at a specific temperature, time.
The first component of the equation, Cp(dT/dt), is the heat capacity component; the glass transition will be expressed in this component. Evaporation, cure reactions, crystallization, denaturation, and decomposition are expressed in the kinetic function. Melting, a latent heat, is an endothermic enthalpy change and may be expressed as a sum total of both heat capacity and kinetic components within the melting temperature range. Modulated DSC (MDSC), an advanced technique where the heating rate of the furnace undergoes a fixed frequency, sinusoidal oscillation, assists in the deconvolution of the total heat flow signal into the heat capacity and kinetic components—whereby events such as a glass transition masked under an evaporation peak, or the simultaneous occurrence of a cold crystallization with a melt, are easily revealed. When performing DSC experiments, there are several considerations1,4,5:
- Instrument calibration for temperature and enthalpy (as outlined per DSC manufacturer)—Calibration takes into consideration the temperature range, purge gas used in the test chamber, DSC pan configuration, and heating rate
- Sample preparation, sample mass, and encapsulation in a DSC pan—DSC requires minimal sample preparation compared to other techniques; however, it is best if the sample is prepared so that it has good thermal contact with the bottom of the DSC pan for optimal heat transfer to and from the area detector
- Heating rate, start and end temperatures, and heat/cool/heat cycles of the experimental profile.
Note: Based on Eq. (3), increasing the sample mass and heating rate will increase the amplitude of the heat capacity component, which is directly proportional to the sample heat flow. This is an important correlation, as it allows the researcher to directly optimize the quality of data by defining the experimental conditions of a test. Figure 5 illustrates the improved sensitivity of a weak glass transition of an amorphous polymer when the heating rate is increased.
 Figure 5 – Improved sensitivity of a weak glass transition of an amorphous polymer when the heating rate is increased.
Conclusion
Differential scanning calorimetry is a powerful technique used to monitor endothermic and exothermic heat flow changes of materials with respect to temperature and time. Indeed, it has emerged as an essential tool used in the laboratory to test a broad range of materials in research, development, and processing.
References
- Höhne, G.; Hemminger, W. et al. Differential Scanning Calorimetry—An Introduction for Practitioners; Springer: Berlin, 1996, pp. 8, 39.
- Danley, R.L. New heat flux DSC measurement technique. Thermochim. Acta 2002, 395, 201–8.
- Wunderlich, B. Thermal Analysis of Polymeric Materials; Springer: New York, NY, 2005, p. 332.
- Ford, J.L. and Timmins, P. Pharmaceutical Thermal Analysis—Techniques and Applications; John Wiley and Sons: New York, NY, 1989, pp. 69–84.
- Ehrenstein, G.W.; Riedel, G. et al. Thermal Analysis of Plastics—Theory and Practice; Hanser Publishers: Cincinnatti, OH, 2004, Chap. 1 and 2.
Kadine Mohomed, Ph.D., is product manager, TA Instruments-Waters LLC, 159 Lukens Dr., New Castle, DE 19720, U.S.A.; tel.: 302-427-4083; e-mail: [email protected]; www.tainstruments.com