Featured Article

Use of three-dimensional cell cultures (e.g., spheroids, microtissues, organoids) for drug screening has increased with the recognition that these models more accurately mimic the in vivo environment and therefore offer improved relevancy compared to traditional 2-D monolayer cultures. Despite the more widespread adoption of 3-D approaches, challenges remain as to the manner in which spheroid cultures are characterized and analyzed. This analysis is particularly important when screening compounds in spheroid culture, as cells typically develop into layers, including a proliferating zone; a quiescent region of viable cells; and a hypoxic, necrotic core (Figure 1). It is important to image all regions of the spheroid to properly assess the impact of drug candidates.
 Figure 1 – Cells grown in 3-D culture exhibit different characteristics depending on their location in the spheroid, which determines exposure to various culture conditions and drug concentrations.
Imaging analysis of 3-D cultures is challenging due to their thickness (typically >100 μm), which causes light scattering and limits imaging to the surface-layer cells, preventing complete characterization of the cell population within whole-mount 3-D cultures. Furthermore, this technical limitation introduces an unavoidable sampling bias in imaging analysis, since only the exterior cells can be imaged where concentrations of nutrients, oxygen, and drug compound are greatest.
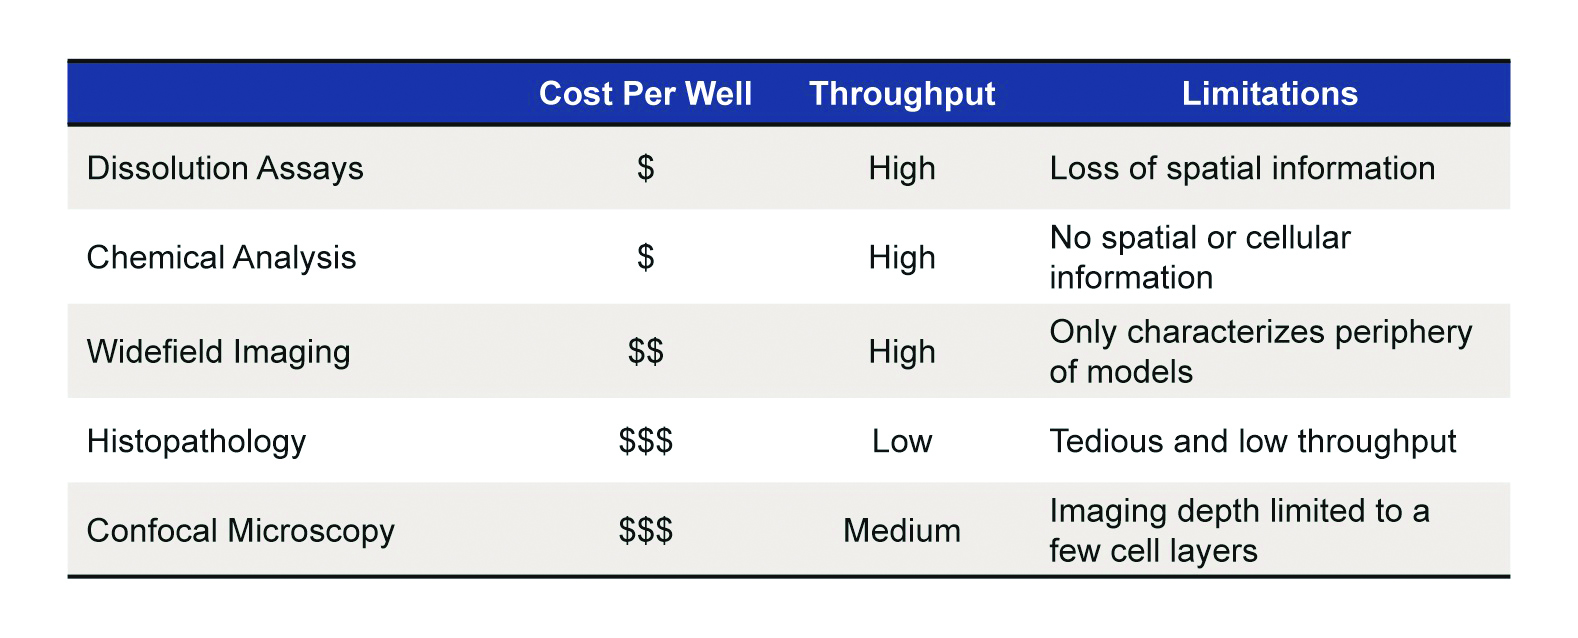
As summarized in Table 1, currently available analytical techniques have critical limitations when applied to 3-D models:
- Traditional pathology requires cells to be removed from well microplates and processed. While this method is capable of acquiring extensive information, the process is extremely low-throughput, tedious, and expensive.
- Dissolution-based assays, in which cell culture models are homogenized and analyzed using a fluorescence probe, are high-throughput, but the information provided is about the total population of cells without a spatial context.
- Well microplates can be characterized using widefield imaging using fluorescent markers such as green fluorescent protein (GFP), immunofluorescence, and chemical dyes. Such assays suffer from a fundamental limitation in that light attenuation results in an imaging depth of only a few cell layers. As a result, only data from the periphery of the model is obtained that can differ substantially from the core.
- Confocal imaging of 3-D cell culture models can be high-throughput, and while these devices allow for a reduction in out-of-plane light, improved image quality, and z-stacks, they are still limited by light attenuation; thus, only the periphery, where cells are most proliferative, is characterized.
Table 1 – Traditional methods for interrogation of spheroids
Tissue clearing to enable 3-D histology
While the high cellular density of 3-D cultures scatters light and limits the ability to characterize the entire spheroid, several approaches are available for rendering tissue transparent to enable analysis (Table 2). Commonly used clearing techniques have a number of disadvantages when being considered for high-throughput, cost-efficient screening, however. Protein hyperhydration can require days to weeks for clearing, and the process severely reduces tissue integrity. This approach is also not compatible with immunolabeling techniques. Highly lipophilic organic solvents are not compatible with plastic well microplates.
Table 2 – Properties of different tissue-clearing techniques
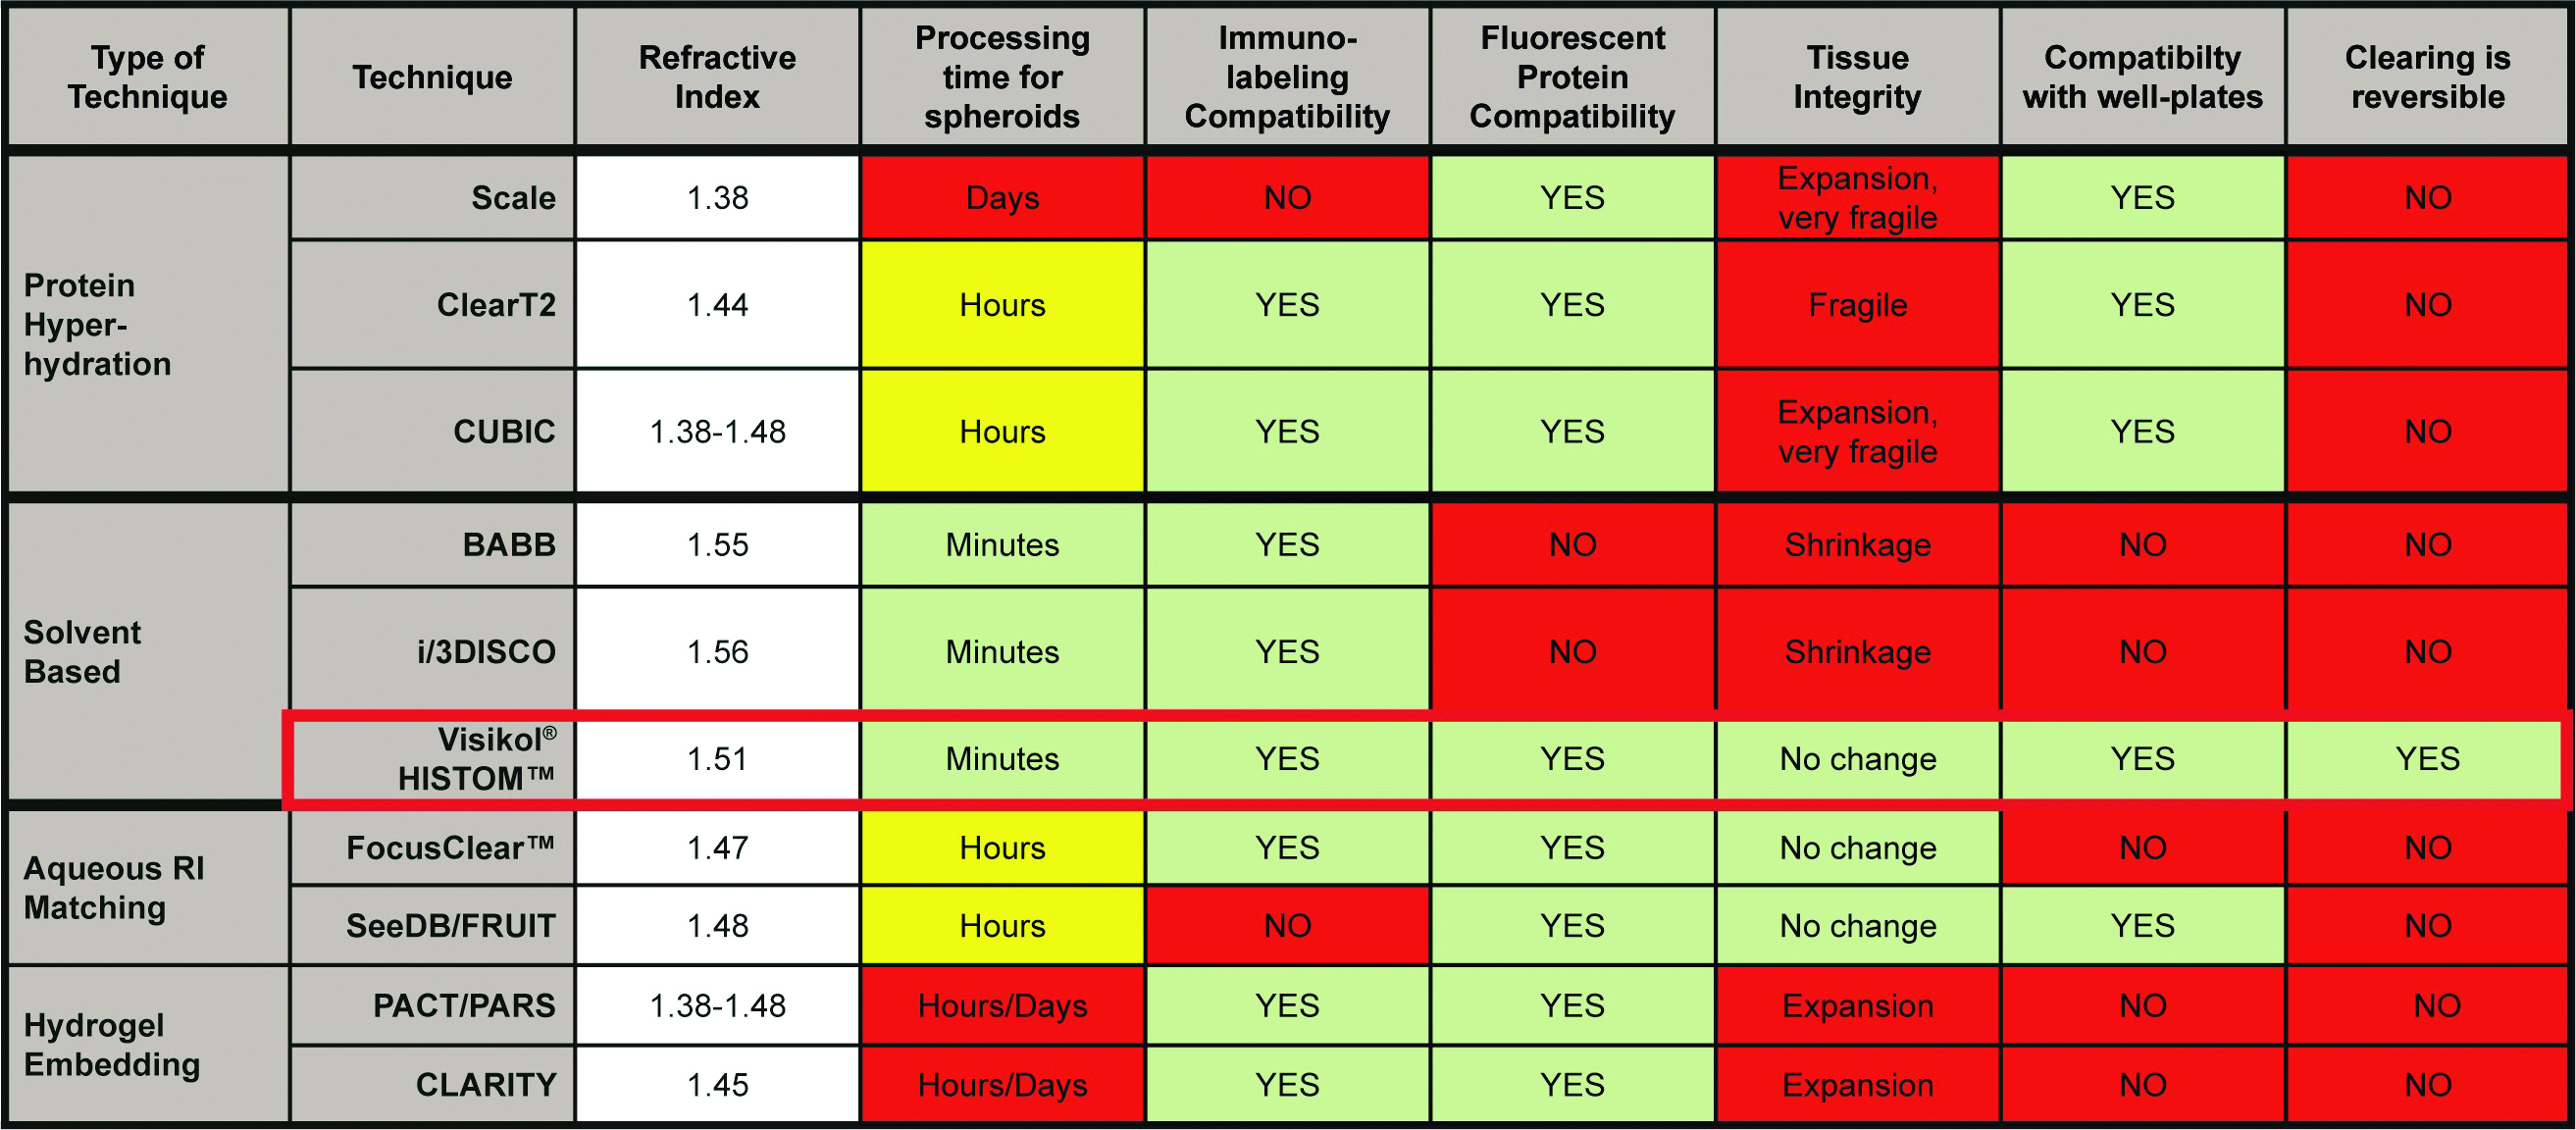
Hydrogel embedding techniques are slow, requiring days to weeks to clear even small tissue samples. This approach uses a complex processing technique that is not amenable to a well microplate format and is thus not useful for medium- to high-throughput applications.
An organic solvent approach (Visikol HISTO-M, Visikol, New Brunswick, NJ) replaces the water in the cytosol and makes the cytosol match the refractive index of lipids and proteins, causing the spheroid to become transparent. Untreated, each cell acts as a lens and scatters light through the spheroid because the proteins and lipids have a high refractive index while the cytosol has a low refractive index. The Visikol HISTO-M reagent rapidly renders tissue transparent and dramatically improves both wide-field imaging and confocal microscopy and visualization of the spheroid interior (Figure 2).
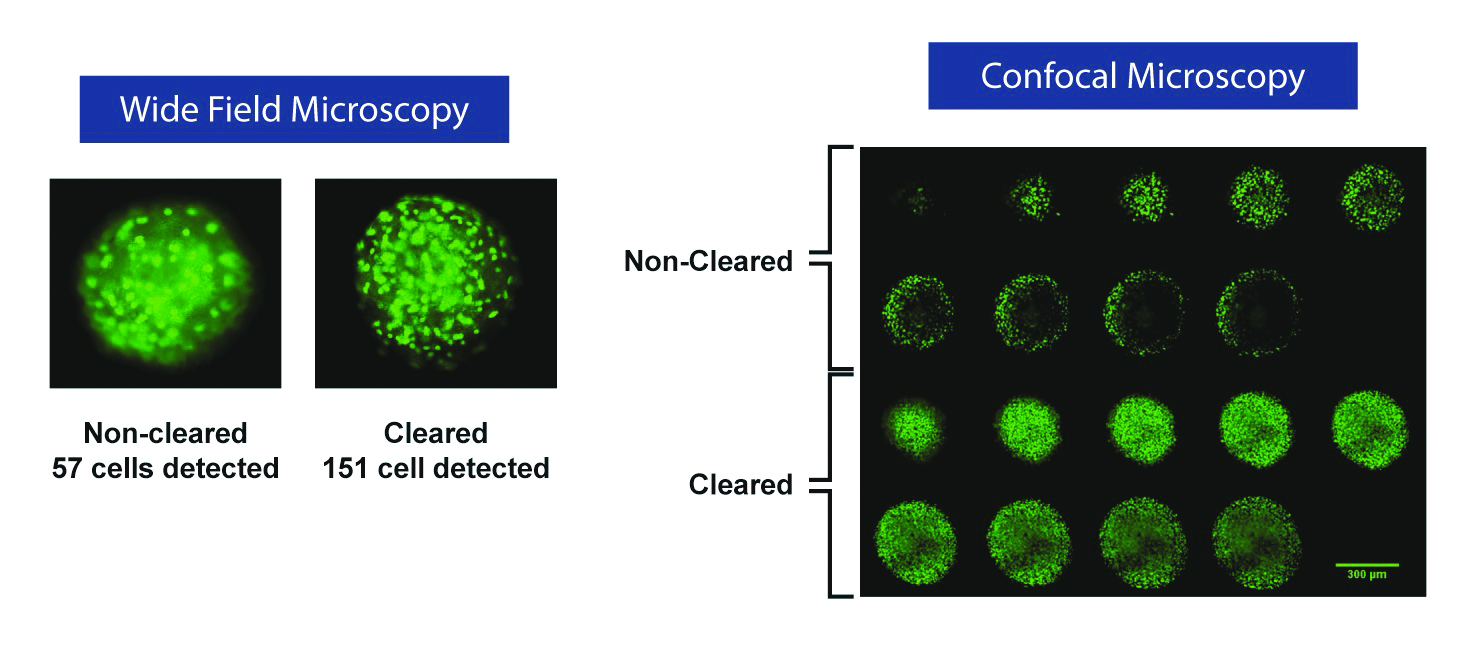 Figure 2 – Once cleared by Visikol HISTO-M, a much larger number of nuclei can be detected via widefield microscopy (left). Montage of slices from confocal image
 z
-stack, nuclei stained with green nucleic acid stain (right). Clearing the tissue eliminated the problem of light penetration into the spheroid.As seen in Figure 2 (left), when imaging 3-D tissue cultures, the interior of the spheroid appears dark (“eclipsing”), as light scattering drastically reduces signal due to the opacity of the spheroids. With use of Visikol HISTO-M, light scattering is greatly reduced, allowing for comprehensive profiling of the interior of the spheroids via confocal microscopy. The ability to detect cells throughout the spheroid corresponds to an approximately fourfold increase in cell counts for a 1000-cell spheroid, significantly increasing the signal-to-noise ratio and allowing more sensitive assays. This clearing method is reversible; treated tissue can be washed with alcohol and processed for sectioning or other assays performed on fixed tissue to validate results.
A critical consideration when imaging 3-D cultures is the localization of the spheroid in the well. Imaging 200–800 µm spheroids in wells that are 5 mm in diameter can be challenging, as flat-bottom microplates allow spheroids to have random placement. With random placement of the spheroid within each well, 36 fields in each well must be scanned, requiring approximately 72 hours per 96-well microplate. Corning Ultra-Low Attachment (ULA) U-bottom microplates (Corning Life Sciences, Kennebunk, ME) are used to form single, uniform spheroids that localize to the center of each well, increasing throughput. An entire 96-well microplates can be scanned in approximately 12 hours, nearly a 6× reduction in time.
3-D imaging of HepG2 proliferation
HepG2 liver hepatocytes were seeded at 1000 wells/cell in Corning ULA 96-well microplates (cat. no. 4520) and grown for two days prior to dosing with paclitaxel at various concentrations (1 µM, 500 nM, 100 nM, 10 nM, and 1 nM). On day four, the spheroids were fixed with 10% neutral buffered formalin for five minutes and then processed for staining. Cells were labeled with anti-human Ki67, a cellular marker for proliferation, and cleared with Visikol HISTO-M.
Figure 3a shows the dose-response curves for cleared and noncleared HepG2 spheroids treated with paclitaxel. Fewer cells were detected in the noncleared spheroids, which resulted in a higher Ki67 percentage; this is to be expected, since the majority of proliferating cells are in the outer layer of the spheroid, which can be readily analyzed in noncleared tissue. The cleared tissue reports a more accurate, overall Ki67 proliferation rate. When the Ki67 percent is measured with respect to the vehicle rather than total cells, the antiproliferative impact of paclitaxel is seen a whole order of magnitude earlier in the cleared cells as there are more cells to count (Figure 3b).
 Figure 3 – Dose-response curves for cleared and noncleared HepG2 cells treated with paclitaxel (a) and curves showing Ki67 percent with respect to vehicle rather than total cells (b).
The data from the cleared spheroids can be further processed to generate dose response as a function of distance from the center of the spheroid, as shown in Figure 4. A similar response is observed for the outermost and middle set of tissues. Interestingly, low doses of paclitaxel increase proliferation at the inner layers compared to vehicle control, presumably due to newly necrotic cells on the outside leaving room for newly proliferated cells in the core. With spatial dose-response data, the ability of a compound to penetrate to the center and effect the deeper layers of cells can be assessed.
 Figure 4 – Evaluation of spatial dose response shows that low doses of paclitaxel increased proliferation at the inner layers of the spheroid, most likely due to the ability of nutrients to reach the center once cells on the periphery have become necrotic.
Conclusion
While 3-D cell culture models are being rapidly adopted in the drug discovery workflow for their improved in vivo relevancy, the imaging modalities used for characterization were originally designed for 2-D monolayer models. Confocal and widefield imaging of 3-D cell culture models is currently limited to only characterizing the periphery. This current paradigm biases results, as only cells most exposed to a compound of interest are evaluated and only a small percentage of the overall population of cells is surveyed.
Using a combination of rapid tissue clearing and ultralow-attachment, U-bottom spheroid microplates, a high-throughput, cost-effective approach for 3-D image-based characterization of 3-D cell culture models has been developed. The ability to survey the entire population of cells within these models delivers significantly more data and allows for complex spatial questions (e.g., colocalization, antibody penetration) to be assessed as well as complete characterization of the effect of compounds and antibodies on entire 3-D cell culture models.
Tom Villani, Ph.D., is chief science officer, Visikol, 120 Albany St., Tower II, Ste. 850, New Brunswick, NJ 08901, U.S.A.; tel.: 800-615-8474; www.visikol.com. Ann E. Rossi, Ph.D., is applications lab manager, and Hilary Sherman is applications scientist, Corning Life Sciences, Kennebunk, ME, U.S.A.; www.corning.com/lifesciences