Featured Article
Assay precision suffers from variability and high standard deviations (SDs). Reducing variability is important for several reasons: 1) the ability to distinguish between results is improved; 2) variability can be confounding in assay development—if assays have insufficient SDs between high and low controls, what may have been an excellent research method may not be suitable for high-throughput screening; and 3) many biological assays have a sigmoidal response curve, and reducing variability allows the use of more of the curvilinear portions of the response, thereby increasing the dynamic range of the assay.
An artificial intelligence process powered by machine learning has been developed that measures variability in microplates on a well-by-well basis, can adjust results to minimize variability, and can be easily implemented. Reductions of 30% in SDs have been demonstrated using this approach.
As part of the development of the PlasmaKnife Microplate Cleaning System (IonField Systems, Moorestown, NJ), testing confirmed cleaning effectiveness by comparing the results from a new plate to the same plate used a second time and then over multiple reuses. Results from individual plates in the multiple reuse group indicated better consistency than similar analysis of results from new plates.
To better understand these results, IonField Systems entered into an informal partnership with the National Center for Advancing Translational Sciences, National Institutes of Health, with the goal of understanding the reason for the differing results. The research plan consisted of using best available analytical methods to examine microplate surface properties, including surface roughness and chemical composition. Scanning electron micrographs (SEMs) were used to assess the microplate surfaces.
SEM results reveal random roughness varying between wells in the same microplate, microplates of the same lot number, and between lots. Thus, one of the earliest conclusions was that surface roughness per se does not affect assay results. However, because surface area increases significantly with roughness, the effect of a rougher surface is to expose the assay liquid to more surface chemicals, thereby introducing a source of variability between wells.
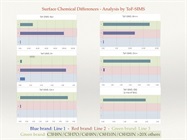
Based on the recommendation of EAG Laboratories (San Diego, CA), a commercial laboratory that provides surface chemical testing, IonField Systems selected time-of-flight secondary ion mass spectrometry (ToF-SIMS) for surface chemical assessment. Of interest were chemicals from production steps that are used to initialize and control the rate of polymerization, control primary and secondary oxidation, and improve polymer flow and mold release during extrusion/molding.
ToF-SIMS, using positive ion analysis, revealed a large number of positive ion species on the surface or within 1 nm of the surface. Three brands of microplate were tested, and no brand had fewer than 27 “nonpolymer” positive ion surface chemicals. A few chemicals were unique to a single brand, but most were common to all brands, varying by brand in concentration. Na+ varied 498-fold and Ca++ 2860-fold. Trace chemicals, such as Pb++, had less than a tenfold difference. Analyses of multiple areas within the same well suggested that the beam hit uneven, irregular surface areas. Measured chemicals varied in the amount detected, while ratios between detected ions were constant.
Figure 1 shows a heat map from a uniform cell assay using BE(2)-C (a human Caucasian neuroblastoma). Each well contains cells without added test compound. These data are from a blue brand microplate.
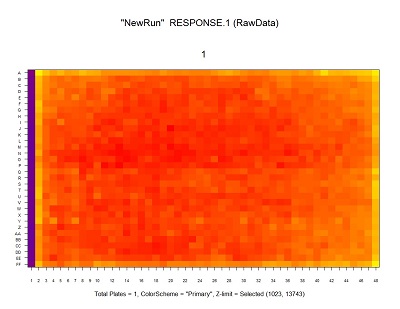 Figure 1 – Heat map of blue brand BE(2)-C raw assay results. Data show typical edge effects of the instrument employed to collect data and a slight unevenness typical with cell assays. Raw data CV (SD/mean) is 5.9%. (Image provided courtesy of ScreenAble Solutions.)
 Shown in Figure 2 are the results obtained by performing a matrix subtraction by well position of two blue brand microplates, then dividing the absolute value of the subtraction by the SD. The y-axis shows a count of wells by 0.1 SD groupings; 97.8% of well positions differ by less than 1 SD. These data indicate that assay results by the same well position between these two microplates have a lower variability than the assay results from all wells of either blue brand microplate.
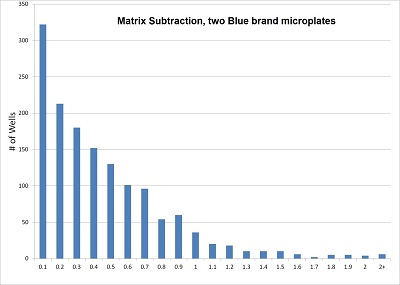 Figure 2 – Count of wells in 0.1 SD groupings from the matrix subtraction of two blue brand microplates. The difference between wells is divided by the SD; 97% of well positions are 1 SD apart or less. Gaussian statistics predict 95% should be 2 SD apart.
Figure 3 compares the assay results of three different brands run with BE(2)-C in all wells without added compounds. This graph represents variations within brands and a larger range of assay results between brands. The smaller variation within a brand is well-to-well differences, and the larger variation shows the effect of surface chemical differences between brands. CellTiter-Glo was used to measure the number of cells, and luminescence was measured on a ViewLux (PerkinElmer, Shelton, CT). The data are presented with pre- and post-application of the AI process.
Figure 3 – Top) Graph of results for all three brands. BE(2)C cells were added, incubated, and the number of cells measured with CellTiter-Glo (Promega, Madison, WI). No compounds were added. The variable in the experiment is the microplate. Bottom) The same data set as shown above after analysis and adjustment with Assay Analytics (IonField Systems). (Note: BE(2)-C is also known as SK-N-BE(2)-C and ATCC CRL-2268.)
Cell growth results were clustered by brand around a mean value. The brands showed a skewing toward low values, reflecting the cumulative effect of decreases in cell viability from chemicals, parallax, thermal effects, or similar processes. With repeating variability removed by the AI process, the range of results provides confirmation of the effect of differences between brands on assay results.
The data for the three curves were processed statistically to determine if the curve shapes were a random Gaussian distribution or nonrandom variation in exposure to plate chemicals, very small differences in well dimension/shape/volume, or other nonrandom cause. This approach compared data from each well position to data from the corresponding well in a paired plate of the same brand. The curve shapes for each brand pair appeared identical; each brand’s curve was unique. Subsequent analysis was run to determine if these results were due to random variation within pairs of plates. If so, the data should conform to classic Gaussian statistics; however, if the well results were not random, the data would show significant statistical differences.
The statistical technique utilized the same matrix subtraction already described. For the blue brand, the plate average was 11,860, and 1 SD was 700; 74.1% of well results were within 0.5 SD, and 97.8% were within 1.0 SD—results substantially better than Gaussian statistics would predict and confirm the data are not Gaussian. The other brand results showed progressively more random variation, indicating less uniformity between plate pairs—79% of results from the red brand and 56% of results from the green brand were within 1.0 SD.
The above statistical analysis demonstrates the potential of using AI/machine language pattern recognition to enhance results from microplates optimally matched to an assay. To test if well variance could be corrected, the mean value of each well was scaled to be the same as the measured mean from the original assay by plate pair. Using data from the blue brand of microplate, the pattern recognition software detected not only the well variance, but also the parallax-related reduction in signal around the edges and corners of the microplate. The statistical analysis process output (Figure 4) yielded an impressive total reduction in SD for the blue brand of 60%. Further analysis revealed that approximately half of this reduction was due to correction of skewing and half from lowering the variance by the described adjustment to the well pair mean.
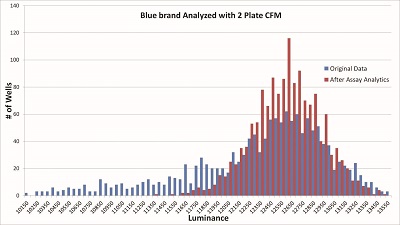 Figure 4 – Overlay of pre- and post-Assay Analytics for the blue brand results. Graphs were aligned matching the five highest peaks of each graph to adjust for the raw data skew that reduced the mean.
The raw microplate surface chemical information was intriguing. When matched with assay data, it establishes a link between the surface chemicals and effects on assay results. In the BE(2)-C example (Figure 3), the lower assay signal from microplate brands 2 and 3 are directly correlated to fewer cells detected by CellTiter-Glo. The surface chemical data in Figure 5 show that the blue brand had low concentrations in identified surface chemicals except for Ca++. The red brand had high concentrations of Na+, K+, Ca++, and Al+++. The green brand had high concentrations of Al+++, and Zn++ and was the only one with ethylene bis stearamide (EBS).
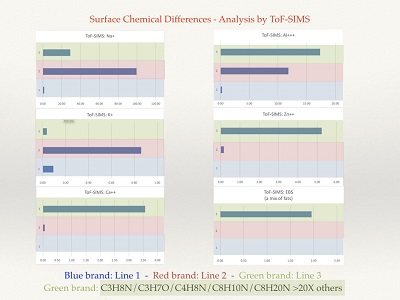 Figure 5 – ToF-SIMS results for the three brands. Each has a different chemical signature. The difference between the green brand mean and blue brand mean is 35%. The data support the theory that microplate surface chemical differences can significantly alter assay results between brands and increase variance within brand.
This experiment demonstrates that low concentrations of chemicals on the surfaces of microplates can affect cell growth rates. In preliminary work, the Assay Analytics process shows similar improvement in homogeneous assays. IonField Systems is collaborating with clients to run more experiments and expects to have results to report later in 2018.
Conclusions
- The example shows the substantial effect of surface chemicals on cell assay results.
- AI-based analysis of individual well patterns is a powerful tool with the potential to reduce the effect on assay variability due to surface chemicals.
- The analysis process adjusts assay results using measurements of each well, avoiding the bias of methods using estimated variance.
- Improvements in assay precision suggest that a 30% reduction in SD can be achieved.
- The method appears to be effective for identifying and correcting other sources of repeating variability if present.
- The method does not require modification to the assay, measurement modality, or instrumentation.
- Repeated plate use eliminates the risks associated with lot-to-lot microplate surface chemical differences.
Paul Hensley is CEO, IonField Systems, One Executive Dr., Ste. 8, Moorestown, NJ 08057, U.S.A.; tel.: 856-437-0330, ext. 101; e-mail: [email protected]; www.ionfieldsystems.com