Featured Article
Historically, most infrared (IR) analyses have been performed using transmission, where the IR light passed directly through a sample of controlled pathlength. While easy and inexpensive, sample preparation plays a huge role in the quality of data produced in transmission. Examples include sample thickness in general (opacity) and mixing and pressing of KBr pellets or bubbles in liquid cells.
Attenuated total reflection (ATR) provides a powerful and often much simpler alternative analysis method. ATR devices, which have steadily improved since the 1970s, are now common and increasingly accepted in industrial and regulatory operating procedures. Even difficult samples, like black rubber or thick plastics, can be analyzed using ATR. However, differences in the appearance of spectra between transmission and ATR can confuse identification, making comparisons with reference materials tricky.
Beer-Lambert-Bouguer Law*
When IR light passes through a molecular material, absorption can occur. The extent of absorption is given by the Beer-Lambert-Bouguer Law (also known as Beer’s Law), where A is the absorption, T is the transmittance, I0 is the incoming intensity of light, and I is the light transmitted through the sample. On the right side, ε is the absorptivity, L is the pathlength, and c is the concentration of the specific analyte.
 .
.
The absorptivity characterizes how much light is absorbed by a specific molecule at a specific wavelength. The product Lc effectively represents how many molecules are in the beam.
Modern FTIR spectrometers equipped with a standard (e.g., DLaTGS) detector respond in a reproducible and reliable manner (linear response), as long as the absorbance A is below about 1.5 absorbance units (Au). If the absorbance is much higher, very little or no light is hitting the detector at that frequency—the sample is “totally absorbing”—and theresponse is not reliab e. A “good” IR peak is typically smooth—Gaussian or Lorentzian—while an overly absorbing peak may have a flat top or a noisy plateau with substantial (meaningless) artifacts. Sample thickness control is critical in ensuring quality transmission spectra. The situation with ATR is both simpler and more complex.
Attenuated total absorption: ATR†
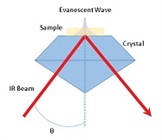
When IR light strikes a properly oriented ATR crystal, the light can reflect internally (see Figure 1). As it does so, a portion of the energy, called the evanescent wave, travels along the surface of the crystal in the medium with lower index of refraction n (nATR > nsample). If a sample is placed in contact with the crystal, the sample may absorb (attenuate) the evanescent wave, resulting in a spectrum. (Note that the size of the evanescent wave is exaggerated in Figure 1 for clarity.) We can assume the concentration and absorptivity act the same as in transmission, but it is the pathlength that leads to different behavior.
 Figure 1 – Schematic of an ATR experiment. The IR light enters, bounces off the surface, and exits the ATR crystal. The evanescent wave (exaggerated in size here) can interact with samples.
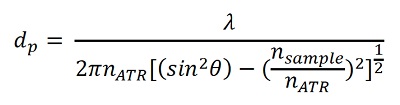
We do not normally speak of a fixed-pathlength L in ATR. Instead, the effective pathlength is controlled by the depth of penetration dp of the evanescent wave into the sample. The depth of penetration relates to the experimental design in a complex manner:
 .
.
Here, λ is the wavelength of the IR light, nATR is the index of refraction of the ATR crystal, nsample is the index of refraction of the sample, and θ is the angle at which the IR light strikes the surface.
To grasp what this means, we need to peel this back one variable at a time, using the spectra in Figure 2 to demonstrate. The sample in both cases is polycarbonate, with the top spectrum collected by transmission, and the second spectrum by (diamond) ATR.
 Figure 2 – Transmission and ATR (diamond ATR) spectra of polycarbonate.
In transmission, the pathlength has sharp boundaries, at the windows or sides of a pellet. In contrast, the intensity of the ATR evanescent wave decays exponentially with distance from the surface—there is no sharp cutoff. Harrick defined dp as the point at which the intensity of the evanescent wave has dropped off by 1/e or roughly 1/3. This means there is intensity further away from the surface, so the tabulated values of dp (see Table 1) are guides, not absolute boundaries. Indeed, IR signals due to components beneath a surface coating may be observed even though they are 3–4 times “deeper” than the tabulated dp.

Two of the quantities in the dp equation—θ and nATR—can be changed, but remain constant during a measurement. The angle is set by the accessory design and can be fixed (typically around 45°) or variable over a range (though fixed when collecting data). As the angle increases, dp will decrease, so a 45° accessory will probe deeper into the sample than a 60° accessory. The crystal type is also constant during the measurement, so nATR is fixed. Changing the crystal is a powerful tool for altering pathlength, with germanium’s high index of 4 giving a very shallow dp under 1 micron at 1000 cm-1, while diamond and ZnSe will dive to over 2 microns. For a strong absorber (where a short Lwould be needed), Ge is the choice, while diamond is effective for most other materials.
From here, the situation gets interesting. The dependence on λ means that, as the wavelength shortens (the wavenumber grows), dp decreases. Look closely at Figure 2. The two peaks near 1500 cm-1 are similar in height. As one moves to a higher wavenumber, the ATR peaks become smaller. Note especially the tiny peak at 3500 cm-1, shown enlarged in the inset. Visible in transmission, the extremely shallow dp at that wavenumber (less than a micron) coupled with the weak ε causes the peak to almost disappear in the ATR spectrum. The C-H region around 2900–3100 cm-1 also shows a lower signal, due to the same small dp. In contrast, at and below 1000 cm-1, the ATR bands become more prominent as dp increases. Essentially, the pathlength L varies across the spectrum.‡
The most fascinating variable is nsample. Most organic materials have a refractive index around 1.5 in the mid-IR region. However, the refractive index changes rapidly in the presence of a strong absorption band—nsample is not a constant! Look at the large peaks of the polycarbonate between 1100 and 1300 cm-1. In the transmission spectrum, the peaks are very strong. Because of this, the refractive index changes significantly in this region, which changes dp (and thus L). Figure 3 shows how the refractive index changes near a strong absorption. It is constant across most of the region, but has a large change near the low frequency peak. Note the peak shifts in Figure 2 and the huge change in the shape of the band around 1235 cm-1 caused by this phenomenon. The shape and location of those peaks changed. The stronger the absorption, the more pronounced the changes.
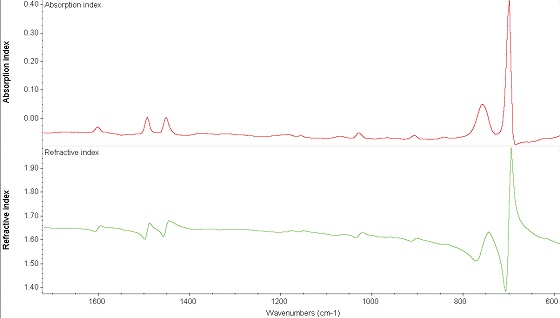 Figure 3 – Variance of the refractive index (bottom) with IR absorption (top).
Search results and ATR corrections
Many libraries—commercial and private—were collected using transmission methods. The changes induced by using ATR will thus lower the match values. Using a standard correlation algorithm, the polycarbonate matches for the top and bottom spectra in Figure 2 are 98 and 80, respectively. Observing the spectra in Figure 2, it would be easy to conclude they were different materials.
First-generation correction algorithms relied on simply correcting for the dependence of dp on λ. This is shown in Figure 4. The influence on the intensities is pronounced; again, note the region between 2900 and 3100 cm-1, and the “depressing” of peaks below 1000 cm-1. Even so, the search result remains about 80—there is more going on here.
 Figure 4 – ATR correction based on
 λ
only.The latest, most comprehensive algorithms, such as the Advanced ATR Correction in the Thermo Scientific OMNIC software (Thermo Fisher Scientific, Madison, WI), correct for both λ and nsample variations, giving a spectrum that is close to having a constant L across the full range. Figure 5 compares the transmission (top) and fully corrected ATR spectrum (bottom). The intensities and peak locations are now very close or identical. The search correlation match value is 98, essentially the same as for the transmission reference sample. Hence, the advanced ATR correction enables the use of classically collected libraries with ATR data.
 Figure 5 – ATR correction based on
 λ
and n
sample.Conclusion
Beer’s Law relates the absorbance to three main quantities—the absorptivity, the concentration, and the pathlength. This article has discussed how the variations in depth of penetration in ATR influence the effective pathlength, especially through the wavelength and refractive index dependencies. This change in turn influences the search results, reducing the observed match value when ATR spectra are compared with transmission libraries. Effective searching is promoted either by using ATR-specific libraries or through the use of Advanced ATR Correction algorithms, such as the one present in OMNIC. With this knowledge, users can optimize their use of ATR devices and extend the usefulness to materials that are very challenging via transmission.
* The discussion of Beer’s Law is limited here to molecular absorptions and IR light. The relationship itself is more general, being used in atomic, UV/VIS, and other spectroscopies.
† The discussion is limited here to so-called “single-bounce” ATR devices. Multibounce ATR can be accounted for simply by multiplying the dp values by the number of bounces, and the Advanced ATR Correction algorithm discussed later accounts for this.
‡ This is also why ATR is not normally usable in the NIR—the depth of penetration is far too shallow (well below a micron) to provide a decent pathlength for absorption.
Michael Bradley is senior manager, Global Training, Thermo Fisher Scientific, 525 Verona Rd., Madison, WI 53711, U.S.A.; tel.: 608-276-6100; e-mail: [email protected]; www.thermofisher.com