Featured Article

Due to its unique physicochemical properties, rhodium is widely used in standard thermocouples, electroplating, the electronics industry, for cancer treatment, and as a catalyst in the chemical and automobile industries. The consumption of rhodium in the production of autocatalysts accounts for more than 80% of the world production of the metal.1 Increasing use of catalysts in automobiles results in emission of rhodium into the environment. Therefore, methods for the accurate determination of rhodium in environmental and biological samples are critical to assess future risk to the ecosystem and human health.
Several analytical methods, such as neutron activation analysis (NAA),2 graphite furnace atomic absorption spectrometry (GFAAS),3,4 inductively coupled plasma-atomic emission spectrometry (ICP-AES),5,6 and inductively coupled plasma-mass spectrometry (ICP-MS),7-9 have been developed for the determination of rhodium at low concentrations. GFAAS was employed here because it combines simplicity, speed, lower cost, and sensitivity. However, the concentration of rhodium in environmental samples is usually too low to be determined directly by conventional techniques due to insufficient sensitivity and matrix interference. For this reason, a separation and preconcentration procedure is often required prior to analysis.
A number of methods for the separation and preconcentration of rhodium, such as liquid–liquid extraction,10 dispersive liquid–liquid microextraction,11 ion-exchange,12-14 sorbent extraction on the various adsorbents (e.g., modified multiwalled carbon nanotubes),15 and resins,16,17 have been developed. Cloud-point extraction (CPE), known as a green liquid–liquid extraction method, is an attractive technique that has been used for preconcentration of organic compounds and trace metal ions.18 Compared with conventional extraction systems, CPE offers various advantages, such as simple operation, low cost, low toxicity, high-preconcentration factor, and easy-to-dispose-of surfactant. In combination with GFAAS, CPE is a convenient and powerful analytical technique for the detection of ultratrace elements.
The aim of this work was to determine trace rhodium in environmental samples by CPE-GFAAS. In the system developed, rhodium formed a neutral hydrophobic complex with chelating ligand 2-(5-bromo-2-pyridylazo)-5-dimethylaminoaniline (5-Br-PADMA).19 The rhodium complex formed was subsequently trapped in the surfactant-rich phase (Triton X-1114, Merck, Darmstadt, Germany), and was then determined by GFAAS. Experimental parameters affecting the CPE were investigated and optimized. The method was applied to the determination of rhodium in water samples with satisfactory results.
Experimental
Apparatus
A TAS-990 atomic absorption spectrophotometer (Beijing Purkinge General Instrument Co. Ltd., Beijing, China) equipped with a GFH-990 graphite furnace atomizer and using deuterium arc background correction was employed throughout. For the radiation source, a rhodium hollow cathode lamp (Beijing Shuguangming Electric light Source Instrument Ltd, Beijing, China) was used. Argon was used as the purge and protective gas. Optimum operating conditions for GFAAS are listed in Table 1. The measurements of pH values were made by a PB-10 digital pH meter (Beijing Sartoris Scientific Instrument Co. Ltd., Beijing, China) supplied with a combined electrode. A model HH-2 thermostated bath (Beijing Kewei Yongxing Instrument Co. Ltd., Beijing, China) maintained at the desired temperature was employed for cloud-point temperature experiments. Phase separation was done using a model 800-1 centrifuge (Shanghai Pudong Physical Instruments Factory, Shanghai, China).

Reagents and solutions
Rhodium(III) standard stock solution, 1000 µg/mL, was prepared by dissolving 0.3248 g of spectroscopically pure (NH4)2 RhCl5∙H2O in 100 mL of 1 mol L-1 hydrochloric acid. Working solutions were obtained by serial dilution of the stock solution with water. Laboratory-synthesized19 5-Br-PADMA solution was prepared in ethanol (5.0 × 10⁻⁴ mol L-1). The nonionic surfactant (1.0 %, w/v) of Triton X-114 was prepared in double-distilled water and was used without further purification. The acetate buffer solution of pH 5.0 was prepared by mixing 0.2 mol L-1 NaAc and 0.2 mol L-1 HAc at appropriate ratios and adjusting pH to 5.0 using a pH meter. The 0.1 mol L-1 HNO3-methanol solution was prepared by mixing 0.2 mol L-1 HNO3 and methanol in equal volumes. All chemicals used were of analytical reagent grade unless otherwise mentioned. All solutions were prepared with deionized water (18.2 MΩ cm) obtained using a Simplicity 185 water purification system (MilliporeSigma, Bedford, MA).
Procedure
For the formation of rhodium complex, an aliquot of rhodium sample or standard solution, 2 mL of pH 5.0 HAc-NaAc buffer solution, and 80 μL of 5.0 × 10⁻⁴ mol L-1 5-Br-PADMA chelating solution was placed in a 10-mL graduated conical centrifuge tube. The mixture was heated in a boiling water bath for 10 min. For the cloud-point extraction, 0.8 mL of 1% (m/v) Triton X-114 solution was added to the formed complex solution and the mixture was diluted to 10 mL with water. The resultant solution was shaken and placed into a thermostatic bath at 60 ℃ for 15 min. Then the solution was centrifuged to separate the surfactant-rich phase containing Rh3+-5-Br-PADMA metal chelates at 3500 rpm for 5 min. After centrifugation, the bulk aqueous phase was easily discarded by inverting the tubes. The surfactant-rich phase in the tube was heated in a water bath at 100 ℃ to remove the remaining water; 20 µL 0.1 mol L-1 HNO3-methanol solution was added to dissolve the remaining phase, and the sample solution was injected into the graphite tube for GFAAS determination of rhodium.
Results and discussion
Effect of pH
The chelating agent 5-Br-PADMA reacts with rhodium to form a hydrophobic complex that is subsequently extracted in the surfactant micelles and separated from the aqueous phase. Structures of 5-Br-PADMA and its rhodium complex are shown in Figure 1.
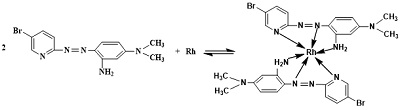 Figure 1 – Structure of 5-Br-PADMA and its Rh complex.
Because the molecule of 5-Br-PADMA contains a ring nitrogen atom and two amino group nitrogen atoms, which can be protonated, 5-Br-PADMA may exist in four species in solution—R, RH+, RH22+, and RH33+. The acidity of the solution determines the concentration distribution of the four species. In addition, the molecule of rhodium complex also has nitrogen atoms that can combine with protons. This will reduce the hydrophobicity of the complex. Therefore, the pH value affects the formation as well as the hydrophobicity of the complex and is a critical parameter. The influence of pH on the CPE was investigated in the pH range 3.5–10.0 using buffer solutions (Figure 2). As can be seen, pH values between 5.0 and 6.0 were optimum for the extraction of 5-Br-PADMA-Rh(III) complex. Hence, a pH of 5.5 was chosen in the subsequent experiments.
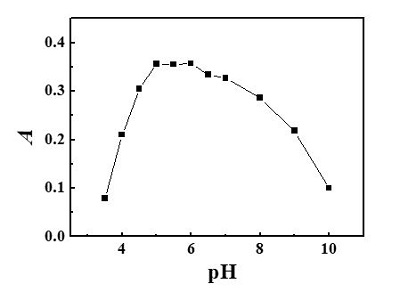 Figure 2 – Effect of pH on CPE for determination of Rh: 0.08 mL 5 × 10⁻⁴ mol·L-1 5-Br-PADMA; 0.80 mL 1.0% (m/V) Triton X-114; temperature: 60 ℃; heating time: 15 min; 1.0 ng Rh/mL.
Effect of amount of chelating agent
Because it is a sensitive and selective chromogenic reagent for rhodium,19 5-Br-PADMA was chosen as a chelating agent to form a hydrophobic complex with rhodium. The effect of the amount of 5 × 10⁻⁴ mol∙L-1 5-Br-PADMA on CPE was investigated with the volumes of 5-Br-PADMA from 10 to 140 µL. As shown in Figure 3, the absorbance first increases significantly with increasing amounts of 5-Br-PADMA, and then reached a plateau when 60–120 µL of 5-Br-PADMA was added. However, the absorbance decreased gradually when the amount of 5-Br-PADMA was increased. Since it has strong hydrophobicity, there was more 5-Br-PADMA and less complex in the surfactant-rich phase with the increasing amounts of 5-Br-PADMA. Hence, 80 µL of 5 × 10⁻⁴ mol∙L-1 5-Br-PADMA solution was used in the subsequent experimental process.
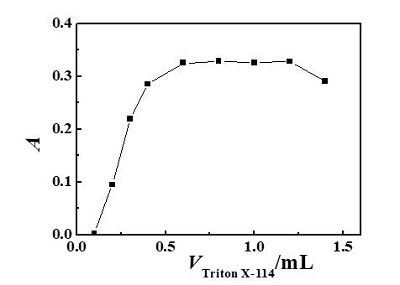 Figure 3 – Effect of amount of 5-Br-PADMA on CPE for determination of Rh: 0.80 mL 1.0% (m/V) Triton X-114; pH: 5.5; temperature: 60 ℃; heating time: 15 min; 1.0 ng Rh/mL.
Effect of Triton X-114 concentration
Triton X-114, one of the nonionic surfactants used extensively in CPE, was chosen as the extractant due to its convenient cloud point (23–25 oC); commercial availability in highly purified homogeneous form; and high density of the surfactant-rich phase, which facilitates phase separation by centrifugation. The amount of Triton X-114 not only affected the extraction efficiency, but also the volume of surfactant-rich phase. Influence of the amount of Triton X-114 on absorbance was evaluated by adding different amounts of 1.0% (m/V) Triton X-114 in the range 0.1–1.4 mL (Figure 4). As can be seen, quantitative extraction was observed when the amount of Triton X-114 was in the range 0.6–1.0 mL. At lower concentrations, the extraction efficiency of the complex is low probably because of the failure of the assemblies to entrap the hydrophobic complex quantitatively. At higher concentrations, the absorbance decreases because of the increment in the volume of the remaining phase. Consequently, 0.8 mL 1.0% (m/V) Triton X-114 (the equivalent of 0.08% Triton X-114) was employed in this work.
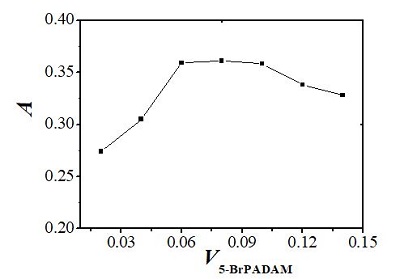 Figure 4 – Effect of 5-Br-PADMA concentration on CPE for determination of Rh: 0.08 mL 5 × 10⁻⁴ mol/L 5-Br-PADMA; pH: 5.5; temperature: 60 ℃; heating time: 15 min; 10 ng Rh.
Effect of equilibration temperature and time
The cloud-point temperature of Triton X-114 is 23–25 oC. With the increase in temperature, the system is further away from the cloud point, causing Triton X-114 to be less water-soluble. The greatest analyte preconcentration factor is reached when the CPE process is conducted with equilibration temperatures well above the cloud-point temperature of the system.20 The effect of equilibration temperature and time was investigated within the ranges 40–90 °C and 5–30 min, respectively. The result shows that maximum absorbance and good phase separation were achieved when the temperature was over 50 °C. Therefore, 60 °C was employed as the working equilibration temperature. When the temperature was fixed at 50 °C, the signal was almost constant after 10 min. Therefore, an equilibration time of 15 min was selected.
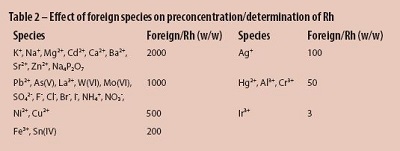
Interferences
The influence of foreign species on the determination of 1.0 ng/mL rhodium ion by the proposed method was studied and a relative error of ±5 % in the absorbance was considered tolerable. The tolerance limits of various foreign species resulted are shown in Table 2.
Analytical features
Under the optimized experimental conditions, the calibration graph was linear over the range 0.05–3.0 ng·mL-1 rhodium. The linear equation was A = 0.0800+0.2626c, where A is the absorbance and c is the cobalt concentration in solution (ng∙mL-1); the correlation coefficient was R = 0.9986. The detection limit, calculated as three times the standard deviation of the blank, was 0.02 ng/mL (3σ). Relative standard deviation (RSD) was 3.3% (n = 6, c = 1.0 ng·mL-1). The enrichment factor, defined as the ratio of the aqueous solution volume (10 mL) to that of the surfactant-rich phase volume after dilution with HNO3-methanol solution (0.02 mL), was 500.
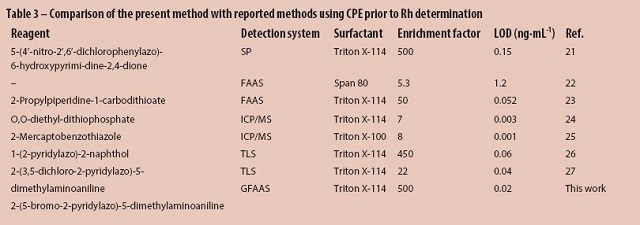
For comparison, the analytical features of the present method and previously reported methods using CPE prior to rhodium determination are given in Table 3. As can be seen, the detection limit of the proposed method is better than those given in the table, with the exception of CPE-ICP/MS. However, ICP/MS, as a multielemental analytical technique, is not available in many laboratories due to the high costs, while GFAAS has the merits of simplicity, low cost, and high sensitivity.
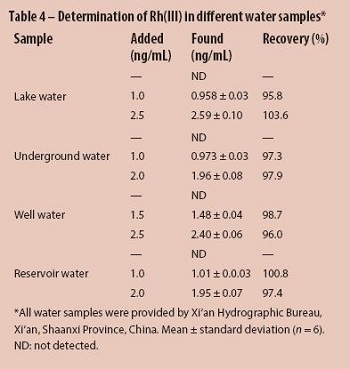
Application of real water samples
The proposed CPE method was applied to the determination of rhodium(III) in spiked water samples to estimate the accuracy of the procedure. All water samples were filtered using a 0.45-µm pore size membrane filter to remove suspended particulate matter. The results are shown in Table 4. Analytical results were in good agreement with the added values using the recommended procedure, and no significant differences were observed (t-test, P = 0.05).
Conclusion
A new method for the determination of rhodium in water samples by GFAAS combined with CPE using 5-Br-PADMA as chelating reagent and nonionic surfactant Triton X-114 as extractant was proposed. The technique developed combines the advantages of CPE with GFAAS and resulted in the sensitive and selective determination of rhodium at trace levels.
References
- Dubiella-Jackowska, A.; Polkowska, Z. et al. Polish J. Environ. Stud. 2007, 16(3), 329–45.
- Li, X.L. and Ebihara, M. J. Radioanal. Nucl. Chem. 2003, 255(1), 131–5.
- Zambrzycka-Szelewa, E.; Lulewicz, M. et al. Spectrochim. Acta Part B: Atomic Spectrosc. 2017, 133, 81–7.
- Sánchez Rojas, F.; Bosch-Ojeda, C. et al. Annali di Chimica 2005, 95(6), 437–45.
- Zhang, G. and Tian, M. Optics and Spectroscopy 2015, 118(4), 513–8.
- Zhang, N.; Ma, Y.F. et al. Anal. Lett. 2014, 47(12), 2072–9.
- Djingova, R.; Heidenreich, H. et al. Anal. Chim. Acta 2003, 489(2), 245–51.
- Rinkovec, J.; Pehnec Silva, G. et al. Bulletin of Envir. Contamin. and Toxicol. 2017, 98(5), 672–6.
- Niemela, M.; Kola, H. et al. Microchim. Acta 2005, 150(3–4), 211–7.
- Lee, J.Y.; Kumar, J.R. et al. J. Hazard. Mater. 2009, 168. 424–9.
- Mohammadl, S.Z.; Shamspur, T. et al. GU J. Sci. 2013, 26(1), 11–9.
- Sánchez Rojas, F.; Bosch-Ojeda, C. et al. Anal. Lett. 2004, 37(13), 2685–2700.
- Kononova, O.N.; Melnikov, A.M. et al. Hydrometallurgy 2011, 105, 341–9.
- Gaita, R. and Al-Bazi, S.J. Talanta 1995, 42(2), 249–55.
- Ghaseminezhad, S.; Afzali, D. et al. Talanta 2009, 80, 168–72.
- Ahmad Panahi, H.; Sid Kalal, H. et al. Microchem. J. 2009, 93, 49–54.
- Coedo, A.G.; Dorado, M.T. et al. Anal. Chim. Acta 1997, 340(1–3), 31–40.
- Bosch-Ojeda, C. and Sánchez Rojas, F. Anal. Bioanal. Chem. 2009, 394, 759–82.
- Han Q.; Huo, Y.Y. et al. J. Instrument. Anal. 2013, 32(8), 988–92.
- Silva, M.F.; Cerutti, E.S. et al. Microchim. Acta 2006, 155, 349–64.
- Mohammed, A.K. and Alaa, S.A. Spectrochim. Acta Part A 2015, 136, 1955–61.
- Roushani, M.; Baghelani, Y.M. et al. Quim. Nova 2014, 37(8), 308–11.
- Suvardhan, K.; Suresh, K.K. et al. Microchim. Acta 2007, 157, 237–44.
- Mesquita da Silva, M.A.; Azzolin Frescura, V.L. et al. Spectrochim. Acta Part B 2001, 56, 1941–9.
- Simitchiev, K.; Stefanova, V. et al. J. Anal. At. Spectrom. 2008, 23, 717–26.
- Bosch-Ojeda, C. and Sánchez Rojas, F. Anal. Bioanal. Chem. 2009, 394, 759–82.
- Han, Q.; Yang, X.H. et al. Am. Lab. 2017, 27, 26–31.
Xiaohui Yang, Quan Han, Huan Wang, Yanyan Huo, Longhu Yang, and Yaping He, are with the School of Chemical Engineering, Xi’an University, Xi’an, P.R. China. QuanHan, Longhu Yang, and Jiangyan Wu are with the School of Chemistry and Chemical Engineering, Yan’an University, Yan’an 716000, P.R. China; e-mail: [email protected]; www.yau.edu.cn. This work was supported by the National Natural Science Foundation of China (No. 21545014, 21445004) and Science and Technology Plan Project of Xi’an, Shaanxi Province, China (No. CXY1631WL006) and National Innovative Scientific Research Project for College Students (201811080001).