Featured Article

Faced with the challenge of growing food in a faster, safer, and more sustainable fashion, many agricultural producers use pesticides to protect crops from environmental pests, such as weeds (herbicides), insects (insecticides), and fungi (fungicides). These chemical and biological agents improve cultivation, but at a cost. Toxic pesticide residues can remain in the crops even after harvesting. Therefore, it is critical to test any food products cultivated in pesticides to ensure that they are safe for public consumption.
Limiting exposure to toxic pesticides
The hazardous level of a pesticide depends on two factors: the pesticide’s toxicity and a person’s exposure to that pesticide. Just a single exposure can have acute effects, such as reduced vision and impaired motor skills. Long-term chronic exposure can lead to more serious illnesses and diseases, including blood and nerve disorders and even cancer. Because of these risks, the U.S. EPA sets tolerance levels, which are the maximum amount of pesticides allowed in or on a food in the United States. In other countries, these tolerances are called maximum residue limits (MRLs). Table 1 shows examples of pesticide tolerances in various commodities according to the EPA.
Table 1 – EPA pesticide tolerances

Pesticide residue analysis
Pesticide analysis is challenging. Over 1 billion pounds of pesticides are used in the United States per year, and there are many different types of pesticides to look for. Pesticides are complex substances, with multiple pesticide residues belonging to multiple classes.
Pesticide analysis may require either a liquid chromatography-mass spectrometer/mass spectrometer (LC-MS/MS) or gas chromatography-mass spectrometer/mass spectrometer (GC-MS/MS). These instruments are referred to as triple-quadrupole mass spectrometers. The type of instrument used will depend on the characteristics of the pesticide, such as polarity, volatility, thermal stability, and ionization efficiency.
LC-MS/MS and multiple-reaction monitoring
LC-MS/MS technology is used to ensure that agricultural crops are safe to consume and under tolerance levels set by the EPA, often a complex and time-consuming process. Research has shown that it is possible to achieve fast quantitative analysis of 646 pesticides with 1,929 multiple-reaction-monitoring (MRM) transitions in just 10.5 minutes.
Using a Shimadzu LCMS-8060 triple-quadrupole mass spectrometer with an ion guide (Shimadzu Scientific Instruments, Columbia, MD), data was acquired at up to 30,000 μ/sec with a 0.1-Dalton step size without the loss of mass accuracy. With a polarity switching time of 5 msec, the LCMS-8060 supported an analysis of 612 pesticides in positive ion mode and 34 compounds in negative mode.
Food extracts of mint, tomato, and apple were supplied by Phytocontrol (Nîmes, France) following established QuEChERS protocols. Final extracts were prepared in acetonitrile without any dilution. Certified reference materials for the Shimadzu Pesticide MRM Library were obtained from ACSD (Trappes, France) as stock solutions. All solvents were of LC/MS quality purchased from Sigma-Aldrich (St. Louis, MO). A six-point calibration curve from 0.002 to 0.1 mg/kg (2–100 pg/μL) was generated using an internal standard method. Two internal standards (Atrazine-d5 and Diuron-d6) were spiked in during the autosampler sequence for quantitation.
The chromatogram of 646 pesticides1 spiked into a mint extract at 0.010 mg/kg and up to 3 MRMs per compound and 5 msec polarity switching time are shown in Figure 1.
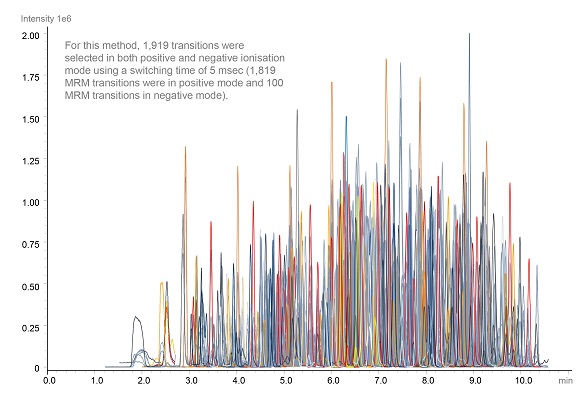 Figure 1 – Chromatogram of 646 pesticides.
MRM chromatograms for pesticides most commonly detected in plant products listed in the 2015 European Food Safety Journal2 are shown in Figure 2.
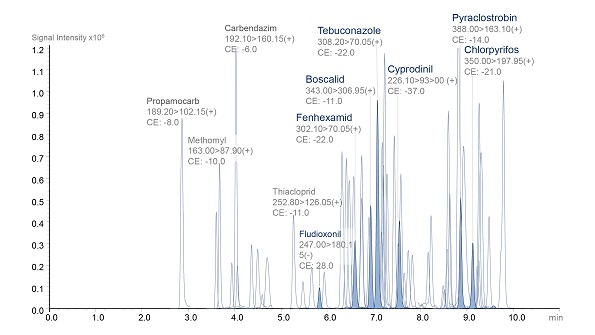 Figure 2 – MRM chromatograms for plant pesticides.
Residues exceeding the legal limits were related to 58 different pesticides. Compounds such as boscalid, chlorpyriphos, cyprodinil, fenhexamid, fludioxonil, pyraclostrobin, and tebuconazole (highlighted in the MRM chromatogram) are some of the most frequently detected compounds present in more than 4% of the samples analyzed. The MRM chromatograms show the response to each pesticide spiked into a food matrix at the default MRL of 0.01 mg/kg.
Between 6.45 and 6.60 minutes, 25 compounds were monitored with a peak area variation less than 6% (%relative standard deviation = 6) (Figure 3).
 Figure 3 – Twenty-five compounds monitored between 6.45 and 6.60 minutes.
Peak area response was tracked for three pesticides spiked into apple, mint, and tomato matrix extracts at 0.05 mg/kg over 72 hours. Compounds were selected to reflect peak area response throughout the chromatographic run (Figure 4).
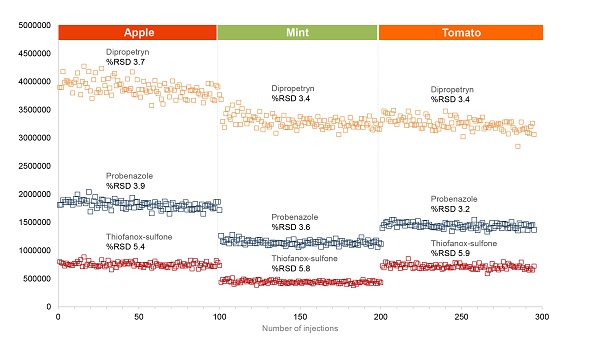 Figure 4 – Peak area response for three pesticides.
Figure 5 shows peak area response for probenazole (RT 5.995 min) and dipropetryn (RT 6.999 min) for injection 1 and injection 100 spiked into apple, mint, and tomato matrix extracts. The extracts were spiked at 0.05 mg/kg and analyzed over 72 hours.
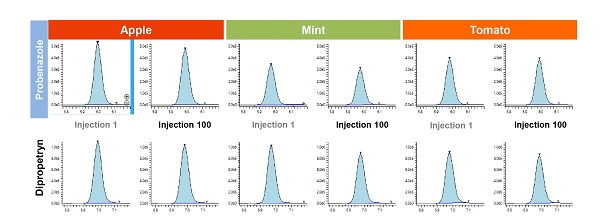 Figure 5 – Peak area response for probenazole and dipropetryn.
As the results demonstrate, with a rapid polarity switching time of 5 msec, the single multiresidue LC-MS/MS method supported the analysis of 34 pesticides in negative ion mode and 612 compounds in positive ion mode. This creates new opportunities in sample dilution to reduce ion signal suppression and matrix effects. For most compounds, a dilution factor of 1:20 or 1:50 was sufficient to provide recoveries in the range 70–120%.
GC-MS/MS to simultaneously analyze residual pesticides
GC-MS/MS systems can measure more than 400 residual pesticides in foods. However, analyzing more than 400 pesticides simultaneously requires a short dwell time (data loading time) during MRM measurements, which results in problems with inadequate sensitivity and the tedious process of creating MRM measurement programs. Consequently, several different methods are used for target pesticides, and the same sample is measured multiple times to analyze all components. This can decrease productivity due to the time required for analyzing all the components involved in the large number of pesticides being inspected.
The research team looked into a solution to these problems with the creation of a method for simultaneously analyzing 477 components and evaluating the resulting sensitivity and accuracy. Matrix solutions were prepared by processing soybean, orange, brown rice, and spinach samples according to a pretreatment procedure for residual pesticide analysis, and then purifying them using the Shimadzu GPC Cleanup System. Measurement sample solutions (1 g/mL sample concentration) were then prepared by spiking the prepared matrix solutions with 477 components (including internal standard substances) to a concentration of 5 ppb (or 200 ppb for the internal standard substances). Nineteen types of surrogate pesticides were used as the internal standard substances.
The Shimadzu GCMS-TQ8040 combined with the Twin Line MS System was used to measure samples, and two transitions were specified for each component, one for quantitation and the other for confirmation. Smart MRM was used to automatically create a measurement program.
 Figure 6 – Relationship between dwell time and retention time.
 The relationship between dwell time and retention time in the measurement program created using Smart MRM is shown in Figure 6. The average dwell time for all components was 12.3 msec, with over 6.5 msec provided even for retention time bands where a high number of pesticides were eluted. Consequently, compared to conventional measurement methods that divide analysis into segments, Smart MRM provided, on average, 2.5 times longer dwell times and made it easy to create optimal MRM measurement programs.
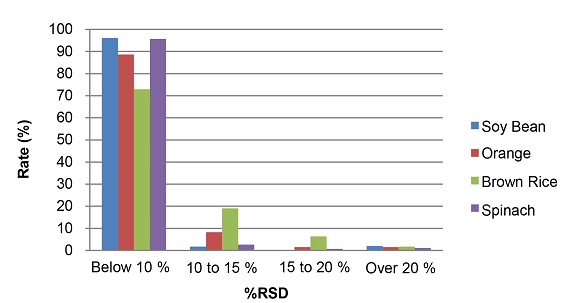 Figure 7 – %RSD distribution.
Repeatability for each matrix was used to evaluate whether the measurement program created using Smart MRM provided adequate sensitivity. The %RSD distribution obtained for each matrix is shown in Figure 7. These results show that %RSD (n = 5) was 10% or less for 88% of targets (1618 of the 1832 components in four types of matrix), which indicates that high analytical accuracy was achieved when analyzing as many as 477 components simultaneously.
By eliminating the need to split the analysis using multiple methods, the number of injections was reduced and productivity increased. This also allows reduced maintenance frequency and costs. Though matrix interference was identified for a few components, high-accuracy detection was possible by using the Twin Line MS system, which uses two columns with different separation characteristics.
Conclusion
Accurately detecting pesticides is critical to the safety of consumers and viability of food producers. With advanced technology and ultrafast scanning capabilities, LC-MS/MS and GC-MS/MS can deliver the high sensitivity necessary to generate quality data for complex samples.
References
- Baker, D.; Fages, L. et al. Fast (10.5 minutes) and quantitative analysis of 646 pesticides with 1,929 MRMs by LC-MS/MS; Shimadzu Scientific Instruments.
- 2015 European Union report on pesticide residues in food. Eur. Food Safety Authority J. 2017, 15(4), 4791.
Bob Clifford, Ph.D., is general manager of Marketing, Shimadzu Scientific Instruments, 7102 Riverwood Dr., Columbia, MD 21046, U.S.A.; tel.: 410-381-1227; e-mail: [email protected]; www.ssi.shimadzu.com