Featured Article

The demand for analyzing cannabinoids in cannabis-infused edibles is increasing every day. Testing laboratories are seeking simple, fast, and accurate analytical techniques to analyze cannabinoids quantitatively to meet quality control objectives and satisfy regulatory requirements.
Most traditional methodologies for the determination of cannabinoids are based on solvent extraction, filtration, and concentration. These techniques are time-consuming and suffer from analyst-to-analyst variability while producing data of limited value.
Thermal desorption-GC/MS (TD-GC/MS) is the most widely used analytical technique for screening and analyzing cannabinoids, while eliminating the sample preparation and solvent extraction steps. In this technique, the sample matrix is effectively isolated from the target analytes. A multimode furnace developed by Frontier Laboratories North America (Antioch, CA) performs thermal desorption and characterizes insoluble complex materials at low levels without any sample pretreatment. The multimode furnace provides unique information about the sample that cannot be obtained using other techniques.
The multimode furnace is distinctive due to its vertical microfurnace design technology and precise temperature programmability. Continuous-mode analysis is performed by the vertical microfurnace, which is directly connected to the GC inlet. Sample introduction is nearly instantaneous. The sample is placed into an easy-access cup and is held at near-ambient temperature in helium. The microfurnace is then preheated to the desired temperature and precisely controlled with a thermal couple sensor. Injection is achieved as the sample cup free-falls into the quartz tube where the sample is vaporized in a few milliseconds. The vapors are then swept onto the GC analytical column for detection by MS or flame ionization detection (FID). Figure 1 demonstrates the system configuration for the pyrolysis-GC/MS technique.
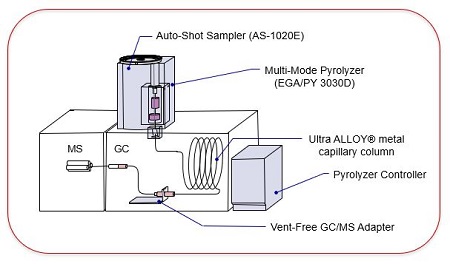 Figure 1 – Pyrolysis-GC/MS system configuration.
The furnace can be used for multiple techniques for analyzing additives, volatiles, monomers, residual solvents, and lighter compounds as well as oligomers and heavier and polymeric materials. Evolved gas analysis, thermal desorption, flash pyrolysis, and heart-cutting are some of the techniques possible with the multimode furnace.
Method Map for analysis of cannabinoids
The Method Map was developed by Frontier to chemically characterize samples using the EGA/PY-3030D Multi-Functional Pyrolyzer in conjunction with a benchtop GC/MS. These techniques are applicable for virtually any organic materials—from volatiles to high-molecular-weight polymers—and require two simple steps for determining the composition of an unknown sample.
The first step is evolved gas analysis (EGA). In this technique, a short, small-diameter, deactivated stainless-steel tube connects the GC injection port to the MS. The sample is dropped into the furnace, which is set at a relatively low temperature (ca. 40–100 °C). The furnace is then programmed to a much higher temperature (ca. 600–800 °C). Compounds “evolve” continuously from the sample as the temperature increases. A plot of detector response versus furnace temperature is obtained. The EGA provides a clear picture of the sample complexity, and one can identify the EGA thermal zone where specific compounds of interest evolve from the sample. The EGA example (Figure 2) contains two thermal zones of interest.
 Figure 2 – Thermal extraction of volatiles, additives, and lighter compounds from heavier and polymeric materials.
The EGA is used to determine the next step in the evolution of the analytical Method Map. As can be seen in Figure 1, one can learn about the volatiles in the sample by simply introducing the sample at 300 °C—only the compounds evolving below 300 °C will be extruded from the sample and transported to the head of the column and analyzed.
To determine both the volatile fraction and higher boiling compounds, two steps can be used: First, the volatile compounds are thermally extracted by dropping the sample into the furnace, which is programmed from 100 to 300 °C. The volatiles collect at the head of the column and are chromatographically separated. During GC analysis of the volatiles, the sample is lifted out of the furnace and rests at near-ambient. Upon completion of the GC run, the GC oven is reset and the furnace temperature is raised to 550 °C for performing the second analysis on the sample. The sample is dropped a second time into the furnace for pyrolysis, and the pyrolysates are trapped at the head of the column and subsequently separated.
Two cannabis-infused edible samples are used here to demonstrate the applicability of the TD-GC/MS technique using the multimode furnace. Both experiments were conducted based on the Method Map and are shown to provide simple, rapid, and accurate quantitative analysis of cannabinoids while enhancing efficiency by eliminating sample preparation prior to analysis.
Analysis of cannabis-infused candy
A commercial individually wrapped candy containing 5 mg of THC (according to the product label) was used for this experiment. To confirm the amount of THC from the label, the candy was analyzed using direct TD-GC/MS as well as thin film techniques. Analysis of the solid is often referred to as a direct method, while analysis of a microliter aliquot of a quantitative solution of the sample is referred to as a thin film method.
EGA was first performed by programming the furnace from 100 to 800 °C (20 °C/min). From the EGA thermogram, the optimal thermal desorption zone of THC was identified as 100–300 °C. The candy was crushed and powdered. A small amount of powdered candy (0.54 mg) was placed into the cup to perform TD-GC/MS analysis (in this approach the candy was analyzed “as is” for the direct method). In the thin film method, 1.0 g of the powdered candy was mixed with 2 mL of isopropyl alcohol (IPA). The mixture was then shaken and sonicated for about 10 minutes to extract cannabinoids. Next, 2 µL of the solution was spiked into the cup to perform TD-GC/MS analysis. In both approaches, the furnace was at 300 °C isothermal for TD analysis. Figure 3 shows the TD-GC/MS chromatograms obtained.
 Figure 3 – Comparison of direct TD and thin film using IPA TD chromatograms.
To calculate the THC concentration, external standard (ESTD) was used. Table 1 shows the results obtained for n = 4 of direct TD and thin film using IPA. From the calculated values, it can be concluded that both techniques are in very close agreement with the product labeling (1 mg/g) of THC.
Table 1 – Comparison of quantitation result between direct TD and thin film with IPA methods

It is important to note that the thin film using IPA approach has less variation for quantitative analysis due to the nature of the sample. The % standard deviation values for TD on the solids and thin film using IPA were calculated as 16% and 2%, respectively. This experiment illustrates the importance of sample homogeneity when performing quantitative analysis. Mixing the powdered candy with IPA and creating a solution provided a more homogeneous sampling in comparison to the direct method.
Analysis of cannabis-infused chocolate
A commercial cannabis-infused dark chocolate bar containing 100 mg THC and with a net weight of 50 g (1.7 oz) was used. According to the product label, there were 20 pieces of chocolate, each containing 5 mg of THC—100 mg/50 g = 2 mg/g of THC in each piece. To demonstrate the accuracy and precision of the TD method, the analysis was performed in triplicate. The weights of each piece were recorded as 0.099 mg, 0.097 mg, and 0.105 mg using an analytical balance.
As with the candy sample, the Method Map was used to analyze the chocolate bar. First, EGA was performed as the rapid screening technique. Then, the optimal thermal desorption zone of THC was identified. The furnace was programmed from 100 to 300 °C (100 °C/min) to obtain the thermal desorption chromatograms for all three pieces of chocolate. Figure 4 shows the TD chromatograms in triplicate. The peaks indicated by (*) between the retention time of 12–14 minutes were identified as THC using the MS interpretation library. The RSD% of 4.6% was calculated based on the area counts of the THC peak.
 Figure 4 – TD-GC/MS chromatograms of chocolate pieces in triplicate.
To confirm the THC concentration in the chocolate pieces, a standard addition calibration curve was generated for THC. The standard solution was a mixture of CBD (cannabidiol), THC, and CBN (cannabinol). Figure 5 shows the calibration curve and calculated amount of THC in the chocolate pieces. Based on the calibration curve, the THC concentration was calculated as 2.1 mg/g per piece of chocolate, which is in agreement with the product label (2 mg/g of THC).
 Figure 5 – Chocolate pieces sample standard addition calibration curve.
Summary
The multimode furnace provides users with a clear picture of a sample’s complexity by identifying the thermal zones and compounds in each zone. Using the obtained EGA thermogram, one can simply program the furnace with the appropriate temperature and method. This technique eliminates traditional solvent extraction and sample pretreatment as the sample is introduced into the GC/MS by the pyrolyzer. As demonstrated, the cannabinoids are thermally extracted from the mixture and are quantified.
Importantly, the vertical microfurnace technology performs continuous-mode analysis in which the sample is not subjected to heat prior to analysis.
Rojin Belganeh is technical director; William Pipkin is global consultant; and Terry Ramus is application scientist, Frontier Laboratories North America, 5141 Lone Tree Way, Antioch, CA 94531, U.S.A.; tel.: 925-813-0498; e-mail: [email protected]; www.frontier-lab.com. The authors thank Itsuko Iwai, R&D chemist, Frontier Laboratories North America, for contributing to the article and performing the analytical work, without which this article would not have been possible.