Featured Article
Breast cancer is one of the most commonly diagnosed cancers among American women, and while early detection and intervention have led to a reduction in the associated mortality rate over the past few decades, the development of targeted, patient-specific therapies promises greater success in treating the progressed disease. For example, estrogen receptor (ER), which is expressed by tumors in a subset of breast cancer patients, can facilitate expression of genes responsible for growth and proliferation of breast cancer cells,1 and thus is an attractive therapeutic target.
Given the rapid pace and growing expense of therapeutic development, high-content in vitro screening approaches are a promising approach for assaying target-specific effects of novel drug candidates. However, since cell–extracellular matrix (ECM) interactions, which are not represented in traditional 2-D cell culture models, are crucial to the expression of drug targets,2 the application of 2-D cell culture models is an ineffective means to screen targeted therapeutic compounds. Specifically, in the context of breast cancer, several investigations have reported a loss of ER expression throughout standard 2-D culture.3
In order to explore the effect of 2-D versus 3-D culture on both ER expression and the consequential response of each culture model to a variety of ER-targeting and nontargeting therapeutics, the commercially available Cellaria Wood cell model (Cellaria Biosciences, Wakefield, MA) was implemented. Cells were cultured in either 2-D or 3-D formats, labeled with a viability indicator and antibodies against ER and Ki67 (to determine proliferation), cleared with Visikol HISTO-M (Whitehouse Station, NJ), and imaged via high-content confocal microscopy. Analysis of viability and proliferation suggested a difference in expression of ER in 2-D versus 3-D spheroid culture and, consequently, a difference in therapeutic response was observed.
Methods
Wood cell culture
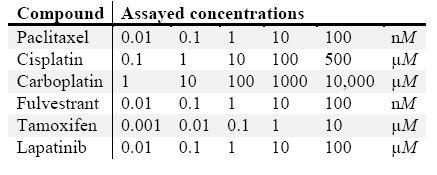
Wood cells, derived from an ER(+), PR (weak+), grade 1, stage T2N0M0 invasive ductal and lobular carcinoma of the breast in a Caucasian female, age 65–69, with a BMI of 33.98, were maintained in Basal Renaissance Essential Tumor Medium (RETM) (Cellaria Biosciences) with RETM supplement, 25 µg/mL cholera toxin, 5% fetal bovine serum, 1× antibiotic-antimitotic in a humidified, 37 °C, 5% CO2 incubator, and passaged via light trypsinization with 0.05% TrypLE (Thermo Fisher Scientific, Waltham, MA) and 1 mM ethylenediaminetetraacetic acid (EDTA) upon reaching 80% confluence. Trypsinized cells were resuspended in complete medium and 1 × 10³ cells per well were plated in a Corning 384-well Round Bottom Ultra-Low Attachment Spheroid Microplate (Corning, NY) or 2 × 10³ cells per well were plated in a Thermo Fisher Nunc 96-well, optical bottom, tissue culture-treated plate. After two days in culture, cells were exposed to drugs at doses listed in Table 1 and cultures were maintained for an additional two days prior to labeling.
Table 1 – Dosing scheme
Staining and fixing Wood cells
Cells were washed twice with 1× Dulbecco’s phosphate-buffered saline (DPBS) and labeled with 1:1000 Thermo Fisher LIVE/DEAD Fixable Red Dead Cell Stain in PBS with a 1:400 dilution of Nucview 488 (Molecular Devices, San Jose, CA). Following 45 minutes of room-temperature incubation with the staining solution, cells were washed, fixed with 10% neutral buffered formalin, permeabilized with 0.2% Triton, blocked with Visikol HISTO Blocking Buffer, and labeled with a 1:200 dilution of anti-Ki67 in Visikol HISTO Antibody Buffer, each for 1 hr at room temperature. Primary labeled cells were then washed with Visikol HISTO 1× Washing Buffer three times and labeled with a 1:200 dilution of Alexa Fluor 647 anti-rabbit secondary antibody plus a 1:5000 dilution of 4’,6-diamidino-2-phenylindole (DAPI) in Visikol HISTO Antibody Buffer for 1 hr at room temperature. Select spheroids and 2-D cell cultures were labeled separately with either DAPI only, Alexa Fluor 488 anti-mouse secondary antibody only, or anti-ERα plus Alexa Fluor 488 anti-mouse secondary and DAPI.
Clearing and high-throughput imaging of spheroids and 2-D cell cultures
Stained spheroids/cells were washed twice with Visikol HISTO Washing Buffer, once with deionized water, once with 50% methanol in deionized water, and once with 100% methanol. For clearing, as much methanol as possible was removed from each well, and Visikol HISTO-M was added. A Cellnsight CX7 LZR High Content Screening Platform (Thermo Fisher Scientific) was used to obtain z-stacks for each spheroid/cell culture (10 µm steps for spheroids, one step for 2-D cultures), and image analysis was performed using both custom ImageJ macros and CellProfiler.
Results and discussion
Wood cells exhibit ER expression in 3-D but lack detectable ER expression in traditional 2-D cell culture
ER expression, confirmed by immunohistochemistry of original tumor biopsy (Figure 1A), was detectable in spheroid culture of the Wood cell line (Figure 1B). However, in 2-D culture, fluorescence intensity of ER-labeled Wood cells was similar to that of non-ER labeled controls (Figure 1C and 1D), suggesting that ER is not expressed by Wood cells at detectable levels in 2-D culture, despite its expression in 3-D cultures. This finding is in line with reports of ER-expression loss throughout culture via standard 2-D approaches.3
Figure 1 – ER expression in original biopsy (A), 3-D (B), and 2-D (C) Wood cell cultures. (D) Fluorescence intensity of each labeling condition in C. Data represent mean ± standard error of the mean; statistical significance determined using one-way analysis of variance.
Differences in 2-D versus 3-D drug response implicate ER expression in spheroid culture in inducing sensitivity to ER-targeting drugs
Treated spheroids (e.g., Figure 2) or 2-D cultures (images not shown) were cleared, imaged, and quantitatively analyzed to elucidate the dose response of Wood cells to various drug compounds in each format.
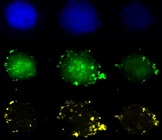
Figure 2 – (A) Z-projections of confocal stacks from increasing dose of fulvestrant; dose indicated by triangle above. (B) Untreated (left) and 1 nM fulvestrant-treated (right) Wood spheroids, merged, scale bar 50 µm.
Given the higher drug availability in 2-D cell culture formats, the dose at which proliferation was reduced by half (denoted as IC50) for several of the assayed drugs was lower in 2-D versus 3-D Wood cell cultures (i.e., cisplatin, taxol, tamoxifen; Figure 3, inset table). However, the proliferation of Wood cells cultured in 3-D exhibited greater sensitivity to fulvestrant (an ER-targeting drug) relative to 2-D cultures (Figure 3). This is likely attributable to the lack of detectable ER expression in 2-D cultures (Figure 1C and 1D).
Figure 3 – Quantification of proliferation (Ki67+, as a percent of total cells, normalized to vehicle controls) of Wood cells, cultured in 2-D or 3-D formats and treated with a variety of antineoplastic agents. IC50 from dose–response curves shown in inset table.
Figure 4 – Quantification of viability (LIVE/DEAD stain+, as a percent of total cells) of Wood cells cultured in 3-D and treated with a variety of antineoplastic agents at doses within range of literature-reported clinical IC50 values. (Abbreviations: Carb = carboplatin, Cisp = cisplatin, Fulv = fulvestrant, Lapat = lapatinib, Tamox = tamoxifen).
Moreover, when Wood cells were cultured in 3-D spheroid format and treated with doses of antineoplastic agents that correspond to IC50 values reported in the literature based on clinical data, the percent of nonviable cells of total was greatest for fulvestrant-treated spheroids, indicating therapeutic utility of this targeted therapeutic. (See Figure 4.)
Together, these data suggest that not only is model choice crucial to recapitulating targeted effects of chemotherapeutic agents, but comparison of in vitro model formats allows for the generation of mechanistic hypotheses regarding the mechanism of action of targeted and nontargeted therapeutic strategies.
Conclusion
Wood cell cultured in 3-D spheroids and standard 2-D cultures exhibit different ER expression and consequently different sensitivity to targeted and nontargeted chemotherapeutic agents, underscoring the importance of model choice (2-D versus 3-D) in drug screening applications. Comparison of in vitro model formats may enable the generation of mechanistic hypotheses regarding the mechanism of action of targeted and nontargeted therapeutic strategies. Furthermore, the use of Visikol HISTO-M permitted clear visualization of the interior of multicellular spheroids, thus facilitating the detection and quantification of cell viability and proliferation in the context of 3-D breast cancer models.
References
- Duffy, M.J. Estrogen receptors: role in breast cancer. Crit. Rev. Clin. Lab. Sci. 2006, 43(4), 325–47.
- Langhans, S. Three-dimensional in vitro cell culture models in drug discovery and drug repositioning. Frontiers Pharmacol. 2018, 9, 6.
- Duss, S.; André S. et al. An oestrogen-dependent model of breast cancer created by transformation of normal human mammary epithelial cells. Breast Cancer Res. 2007, 9(3), R38.
Erin E. Edwards, Thomas S. Villani, Graeme Gardner, and Michael T Johnson are with Visikol Inc., 295 U.S. Highway 22 E, Ste. 10, Whitehouse Station, NJ 08889, U.S.A.; tel.: 800-615-8474; e-mail: [email protected]; www.visikol.com. Elin Agoston is with Cellaria Biosciences, Wakefield, MA, U.S.A.