Introduction
Dynamic Light Scattering (DLS) has become a major asset in the lab toolbox for the characterization of colloids. Ease of use, fast availability of results within minutes and a relatively low sample volume requirements, affirm DLS as an invaluable technique. DLS will supply, without the need of a calibration, size of the sample under investigation and size distribution information, within certain limitations. This is achieved without the need of prior separation of any kind, mechanical or chemical. As such, the application of DLS is almost unlimited, ranging from polymer solutions to dissolved systems and sizes on the low nanometer range, up to particle dispersion with sizes ranging up to 10 µm.
However, in order to extract the information available from a DLS measurement, and most of all to assure the extracted values are representative for the given sample, we must take a step back and understand what DLS really measures. Additionally, out of this primary information, how the final results of size and size distributions are calculated.
The fundamental principle of DLS and all calculations following the measurement itself, is the determination of the translational diffusion coefficient of particles in suspension. The measurement is performed by directing a monochromatic beam of laser light through the sample in which the suspended particles undergo random thermal motion according to Brownian diffusion. The speed of this Brownian motion is a function of size; large particles will show slow speed while smaller ones will move faster. Measurement of the speed of movement, or translational diffusion, is achieved by the determination of the autocorrelation function of the small fluctuations in the intensity of light scattered by the sample at a given detection angle.
DLS is a well known, and powerful technique, for the size determination of nanoparticles and proteins. Its value has been demonstrated in many publications. Proteins, however, still represent a challenge by themselves. Many common globular proteins are very small in hydrodynamic size, with monomers rarely greater than 10 nm, and many approaching 1 nm or smaller on the low end. Size determination of such small particles is by itself difficult as the diffusion coefficient, which is the basis for the calculation of hydrodynamic size, is typically very high, requiring a sophisticated high-speed correlator with appropriately spaced delays for determination of the autocorrelation function for such rapidly diffusing particles. Protein aggregates can easily reach large sizes, on the order of several hundred nm or larger, which complicate this already challenging measurement. This is demonstrated clearly with monoclonal antibodies (mAb). These results are contrasted with those obtained from serum albumin (BSA).
Methods
DLS measurements were made on a continuous multi-angle goniometer, the BI200SM, using a red, λo = 640 nm, 40 mW solid-state laser and an APDx detector, with a USB TurboCorr correlation card. A correlator layout was selected such that large diffusion coefficients, of this type see for small, rapidly diffusing, protein-sized particles, can be effectively resolved. These correspond to extremely small τ values, on the order of less than 100 ns.
For a known scattering angle, θ, and refractive index, n, the scattering vector q is calculated from the following expression:
A given correlation function C(τ) is deconvoluted into either a single-exponential, stretched-exponential, or sum of exponentials. The result of this deconvolution is a characteristic decay rate, Г, and typically also a polydispersity index (PDI). Г is related to the translational diffusion coefficient (Dt) as follows:
Г = Dt*q2
The relationship between Dt, the primary quantity measured in DLS, and hydrodynamic particle size, dh, is inverse, and is given by the Stokes-Einstein Equation:
Dt = Kb T / 3πηdh
Where the Boltzmann constant (Kb), Temperature (T), and bulk viscosity (η) are all known values.
Results & Discussion
Dedicated high-speed correlator channels make it viable to measure such rapidly diffusing, small proteins. For a typical medium-sized protein, decay rates (Г), of as low as several hundred s-1, and as high as 50,000 s-1 may be observed, depending on the scattering angle. As shown for serum albumin (Fig 1), Г depends linearly on q2, for a particle of a given size. When measurements are made at a series of appropriately spaced scattering angles, commonly between about (θ = 10, 155 o), the slope of this Г vs q2 plot is used to determine an average Dt. So long as this dependence is linear, it is only necessary to measure at a single-angle, and particle size can be determined from an arithmetic rearrangement of the basic scattering equation, where the average decay rate, Г, or a distribution of Г’s, can be obtained from direct processing of a correlation function.
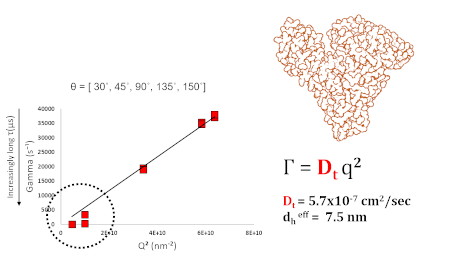
Figure 1 – DLS results for serum albumin monomer as a function of θ. Effective dh = 7.5 nm. For this Г vs q2 dependence to be useful, a minimum of 4-5 scattering angles is required.
Common DLS configurations, as seen on discrete-angle benchtop instruments, tend to use backscatter, right-angle, and forward-scatter (θ = 173, 90, and 15 o). Generally, backscatter is useful for measuring samples in which there is a mixture of large & small particles, since larger angles minimize the d6 bias towards larger particles, which would otherwise obscure scattering from smaller particles. In contrast, very low-angles, typically θ << 30o, are highly sensitive to large particles, especially those >> 1000 nm. While forward-scatter is highly sensitive to the presence of aggregates, backscatter is more useful for accurately determining the size of any small particles that may coexist with aggregated material. As shown in figure 2, the scattering of BSA could easily be mistaken for that of pure monomer, when only examining angles of 90o or higher. The existence of the second mode only becomes obvious at the lowest angle. This also accounts for the deviation from linearity at low angles, or small q2, as seen in figure 1. As we recall, a shift towards slower diffusion, or smaller Г, indicates that larger, slow-moving particles must coexist with monomeric protein.

Figure 2 – Correlation functions obtained at different θ values. Second decay becomes obvious at low-angles.
As shown in figure 3, a stable monomeric monoclonal antibody can be measured effectively at a single scattering angle, θ = 90o (Fig 3: insert). This yields an effective diameter of around 12 nm, and a low, near-zero, polydispersity. The correlation function (Fig 3: main panel) is best described by a single exponential decay, and no aggregate is detected.
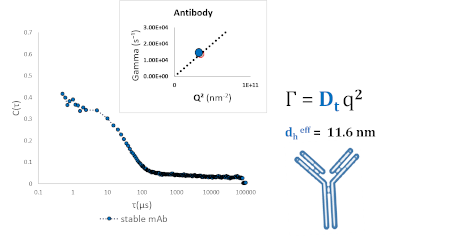
Figure 3 – Dilute monoclonal antibody measured at a ninety-degree scattering angle shows a single effective diameter of around 11.6 nm.
In contrast, a chemically stressed antibody (Fig 4) cannot be described by a single decay, nor can it be meaningfully described as a continuous distribution of particle sizes. It is clear that, in this case, this sample contains multiple discrete, and well-defined populations (Fig 4: lower panel). Since these Г’s span multiple orders of magnitude in s-1, we are able to resolve them only by carefully selecting a correlator layout that covers a wide range of delay times (high, medium and low -speed channels).
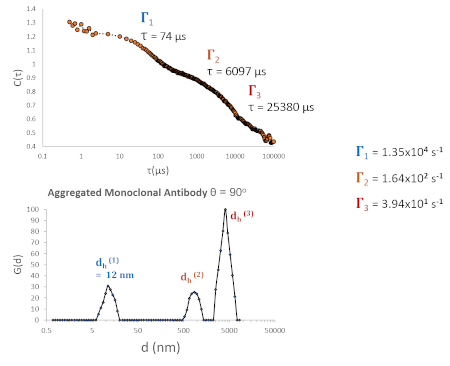
Figure 4 – DLS of chemically stressed monoclonal antibody produces a correlation function with between 2-3 major components (dominant component is aggregated protein). Free monomeric antibody is still fully resolvable from aggregates. The average hydrodynamic diameter is, of course, inflated in this case (dh eff >> 12 nm).
It is also apparent that our choice of scattering angle (Fig 5) benefits us as well, since these rates are only fully resolvable as we approach higher angles. This is in addition to our I(q,τ) ~ d6 dependence, alluded to above.

Figure 5 – Resolvability of multimodal distribution as a function of scattering angle, θ, and scattering vector, q2. Careful choice of both correlation layout, Г(τ), and scattering angle allow for monomer to be measured with a high degree of precision, even in the presence of heavily aggregated protein.
Carlo Dessy is the CEO of TESTA Analytical Solutions and Dr. Daniel Seeman is a Senior Scientist at Brookhaven Instruments