Many industries require high-sensitivity instruments to ensure both product effectiveness and the health and safety of consumers. Some follow strict legal guidelines while others dictate their own internal quality standards. For example, the pharmaceutical industry follows United States Pharmacopeia (USP) guidelines, which define the concentration limits of elemental impurities. Concentrations for most elements range from 100 ppb (parts per billion) to 10 ppm (parts per million)(1). In the up-and-coming cannabis and hemp industry, regulatory requirements vary drastically from state-to-state. In the few states that require heavy metal testing, laboratories generally adopt the standard methods established by the pharmaceutical industry. On the other hand, companies in less regulated industries can use strict internal standards to differentiate from competitors. For instance, in metallurgy and materials science, high-purity metals can range from 99.999% to 99.999999%. The latter indicates elemental impurities are less than 10 ppb.
Despite demand for high-sensitivity instruments, achieving such low detection limits can be difficult. Methods with acceptable detection capabilities typically involve at least one of the following challenges: 1) intricate sample preparation processes, 2) complicated calibration procedures, and 3) expensive, confounding packages of several different instruments. Because techniques like Inductively Coupled Plasma Mass Spectrometry (ICP-MS) require a liquid solution, precise sample digestion and dilution procedures are necessary. ICP-MS and other plasma-source techniques also suffer from spectral interferences and matrix effects, which demand matrix-matched standards for proper calibration. Achieving low detection limits directly from solid sample analyses requires the installation of both an ICP-MS and an additional Laser Ablation (LA) system that is compatible. As a result of the complexity, establishing an efficient workflow is extremely challenging.
The LALI Time of Flight Mass Spectrometer (LALI-TOF-MS)
A new mass spectrometer, the Massbox, is equipped with a Laser Ablation Laser Ionization (LALI) source to overcome these challenges making it the ideal tool for any solid sample analysis that requires trace-level elemental detection. First, the ablation laser facilitates direct sample analysis without the need for complex digestion/dilution sample preparation. The ablation laser’s wavelength is adjustable to facilitate both inorganic quantification and/or organic characterization in the same analytical session. Second, the ionization laser ionizes material within the neutral particle cloud. Compared to ions generated from the initial ablation plasma, the neutral particles experience much less elemental fractionation and matrix effects. Also, because the sample chamber containing the ion source is already under vacuum, it minimizes ion loss through the system. Secondary ionization from the neutrals combined with effective ion transport ensure the final mass spectrum is representative of the sample matrix. The Massbox combines LALI with a time of flight (TOF) mass analyzer. The high scan speed of the TOF analyzer generates a full mass spectrum each time the lasers trigger (20 Hz).
Compared to other direct analytical methods with similar detection capabilities, LALI-TOF-MS does not rely upon components with dynamic fluctuations like a plasma source or any carrier gases. This ensures long-term stability without regular instrument tuning. The Massbox derives its namesake because it enables sample loading, analyzing, and quantifying all in the same compact package, which fits easily on a desktop. Compared to other instrumental systems, this greatly enhances the user experience, and it requires little expertise to operate effectively.
In the 1980s and 1990s, researchers discussed LALI in peer-reviewed literature (2, 3, 4), however, cost and technical limitations precluded such a breakthrough in the technology. Today, advances in computing and miniaturized, high-powered, solid-state lasers, combined with improvements in user interfaces and cloud computing, contribute to LALI-TOF-MS commercialization for simplified solid sample analysis.
Detection Capabilities
Figure 1 shows color-contoured periodic tables comparing detection limits of LALI-TOF-MS to those of other common analytical techniques for solid sample analysis: 1) LA-ICP-MS, 2) X-ray Fluorescence (XRF), and 3) Laser Induced Breakdown Spectroscopy (LIBS). The graph’s color gradient denotes detection limits, and darker colors represent the lowest levels. To meet regulatory and internal quality standards, the previously-discussed industries need detection capabilities in the 10 ppb to 1 ppm range, which are the three darkest shades of blue.

Figure 1: Detection limits for LALI-TOF-MS, LA-ICP-MS, XRF, and LIBS. Each element is colored by its respective limit of detection. Darker colors represent lower detection limits (5).
For LALI, detection limits for most elements range from approximately 1 to 100 ppb or ~0.001 to 0.1 μg/g. Compared to the detection limits by XRF and LIBS, LALI’s limits of detection are approximately three orders of magnitude lower making LALI appropriate for high quality control applications like pharmaceuticals, cannabis and hemp, materials science, and more. XRF and LIBS are often significantly less expensive than LALI-TOF-MS and LA-ICP-MS. Thus, for industries that require only 100-ppm resolution, these methods are appropriate so long as those measurements can quantify the required elements.
Operating Costs
Building upon previously published evaluations, operating costs were compared among the Massbox and two other high sensitivity techniques for solid sample analysis, ICP-MS and ICP-OES (Inductively Coupled Plasma - Optical Emission Spectrometry). This cost comparison is not entirely comprehensive because it does not include the initial purchase price for each instrument; nor does it incorporate the cost and time required for sample preparation. For most spectrometry instruments, major operating costs include gases, electricity, and consumable supplies.
Assuming each instrument runs 1,000 hours per year, Thomas calculated operating costs for ICP-MS, ICP-OES, and two other techniques (6). Using the same assumptions, the operating costs for the Massbox were calculated, and publicly-available salary data were applied to add the operator to the calculation. Because it requires little calibration or training, a technician can easily operate the Massbox. On the other hand, the more complicated operation of ICP-MS involves PhD-trained personnel, and ICP-OES operator costs were based on a senior-level technician’s typical salary.
Figure 2 compares total yearly operating costs among the three methods. Each inset box shows the operating cost per sample, based on how many samples an efficient laboratory can analyze. Compared to ICP-OES and ICP-MS, the Massbox’s LALI technique has 35-60% lower operating costs, and its cost per sample is approximately 10 times lower.
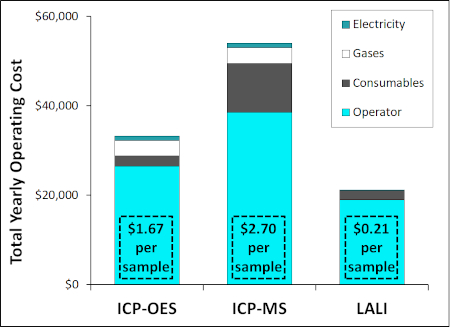
Figure 2: Yearly Operating Costs for ICP-OES, ICP-MS, and LALI-TOF-MS (assuming 1,000 hours of run-time per year) and estimated cost of analysis per sample(6).
Ease of Use
For the Massbox, sample analysis throughput is limited by sample preparation only. The time between loading the sample tray and reviewing results is merely a few minutes. Throughput can be increased even further by loading as many samples as will fit onto the 83 by 83 mm sample stage, which can be modified for specific applications and sample types.
Figure 3 shows two flowcharts to compare the typical ICP-MS analysis process to that of LALI-TOF-MS. The differences between the two highlight both the Massbox’s simplicity and its modularity. The Massbox’s sample preparation may include grinding bulk material into a powder and pressing it into a pellet, or simply polishing the sample to obtain a smooth surface. Not only is this less time-intensive than the more intricate digestion/dissolution procedures for ICP-MS; but the final results are less dependent upon precision. In the ICP-MS flowchart, the right branch describes the steps for matrix-matched calibration of the instrument. On the other hand, the Massbox’s automated analysis only demands the user input a desired spot, line, or raster on the sample. A macro camera takes a picture of the sample before the sample door closes. This allows a customized analytical session in which the user chooses either specific points for bulk analysis or a multi-line raster for chemical mapping. Adopted from the mobile market, the user interface’s touch screen increases intuitiveness compared to other instruments.
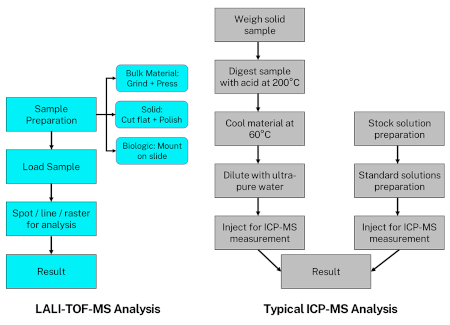
Figure 3: Flow Chart comparing analysis processes for ICP-MS and LALI-TOF-MS.
With an approximate footprint of two feet by two feet, the Massbox’s compact package fits on a desktop with no additional external equipment required (e.g., vacuum pumps on the ground, gas bottles on the wall, additional computer to run the instrument, etc.). This brings high-sensitivity measurements to field, laboratory, manufacturing floor, or warehouse environments that previously could not accommodate the large instrumentation of other techniques.
Summary
From cannabis product manufacturers ensuring the safety of their customers to metallurgists promoting higher purity products than their competitors, many industries value scientific instrumentation with low detection limits. Although many commercial techniques exist for these applications, each comes with challenges and limitations. By using LALI as a source, the Massbox’s hardware addresses these limitations. Plus, the Massbox is an all-in-one, easy-to-use package that simplifies solid sample analysis. As a result, high-quality analytical performance is accessible both to scientists and to an entirely new group of users that would have outsourced such analyses.
References
- USP. US Pharm. 1-3 (2016).
- C.H. Becker and K.T. Gillen, J. Opt. Soc. Am. B2, 1438 (1985).
- C.H. Becker and K.T. Gillen, Anal. Chem. 56, 1671-1674 (1984).
- G.R. Kinsel and D.H. Russell, J. Am. Soc. Mass Specrom. 6, 619-626 (1995)
- J. Williams and J. Putman, Spectroscopy. 35(5), 9-16 (2020).
- R. Thomas. Mass Spectrom. Spectrosc. 18-19 (2016).