Featured Article

Please check out our Electron Spin Resonance Spectrometer / Electron Paramagnetic Resonance Spectrometer (EPS/ESR Spectrometer) section for more information or to find manufacturers that sell these products.
Recent years have seen a dramatic upsurge in the availability of miniaturized sensing technologies. Rapid advances in technology for optical and wireless communications have been applied to scientific instruments, enabling new rugged, portable, highly miniaturized spectrometers. Currently, the high cost, large size, and difficult maintenance of electron spin resonance (ESR) spectrometers limits their use to specialized research centers with highly trained personnel. The trend toward miniaturization of sensor technologies has, until now, not extended at all into the field of electron spin resonance spectroscopy. The state-of-the-art microwave electronics employed in the Micro-ESR™ (Active Spectrum, Inc., Foster City, CA) can significantly reduce both the size and cost of ESR spectroscopy.
Most commercially available ESR spectrometers use X-band (9.5 GHz) microwave technology, such as klystrons, metal waveguides, and cavity resonators.1,2 However, the state-of-the-art radio components used in cellular phones and commercial wireless systems can replace many of the components in the conventional ESR spectrometer with small, low-cost, integrated circuit (IC)-based technology.
Conventional ESR spectrometers have adapted magnets from early nuclear magnetic resonance (NMR) spectrometers. NMR magnets impose very stringent requirements on the field homogeneity because most of the structural information available from NMR spectra is via the chemical shift. Because chemical shifts are typically on the order of a few ppm, magnet homogeneity needs to be ppm or less. For ESR, the physics is quite different. A narrow ESR line has a resonance width on the order of 0.5 Gauss, and typical field strengths are in the range of 1000–4000 Gauss. This places much less stringent requirements on the field homogeneity in the range of 0.01–0.05% (100–500 ppm). In the Micro-ESR magnet assembly, the field uniformity is higher than ±0.25 Gauss in the 10-mm-diam spherical volume surrounding the sample.
The magnet assembly for the spectrometer uses a fixed field of 1180 Gauss provided by a samarium cobalt permanent magnet assembly, which can be swept by ±135 Gauss using a coil. This corresponds to an operating frequency of 3.30 GHz. Since the magnetic field is fixed and is only swept over a relatively narrow range, the power requirements for the Micro-ESR are reduced to approximately 30 W in operation. No special provisions for cooling (e.g., water cooling) are required in practice, although thermoelectric temperature control is often used to reduce thermal fluctuations in the device.
Physical principles

Figure 1 - ESR transitions between spin-up and spin-down electron states.
Electron spin resonance is a type of magnetic resonance. The physical effect was first observed by Zavoisky in 1944. An ESR spectrometer detects the concentration and composition of free radicals present in a sample. Free radicals are atomic or molecular species with unpaired electrons that are often highly reactive. The sample is loaded into a high-frequency resonant cavity in a slowly varying uniform magnetic field. Unpaired electrons irradiated with microwave radiation at a fixed frequency will undergo resonant transitions between the spin-up and spindown state at a characteristic magnetic field, as shown in Figure 1.
The energy difference between these two energy levels is called the Zeeman splitting. For an electron in free space, the Zeeman splitting is equal to:
hν = gβH (1)
In Eq. (1), ν is the excitation frequency, H is the applied magnetic field, β is the Bohr magneton, h is Planck’s constant, and g is a factor that depends on the molecule. Organic free radicals observed at room temperatures usually have g-factors close to 2. The factor gβ/H is very close to 2.8 MHz/Gauss for most samples. For example, if the applied magnetic field H is 0.1 Tesla, the ESR resonant frequency is 2.8 GHz.
The microwave region of the electromagnetic spectrum spans wavelengths between 1 m and 1 mm. Because of the long wavelength, microwave spectroscopy can be used to measure dirty, opaque, and inhomogeneous samples. Even fluids like crude oil can be measured directly with no sample preparation.3,4 At the same time, ESR spectroscopy is highly specific. ESR signals are only observed from molecules with stable unpaired electrons. These include organic free radicals and transition metal complexes. In the case of transition metals, the unpaired d-shell electrons have characteristic ESR spectra, depending on the valence state and metal complex.2
Micro-ESR spectrometer
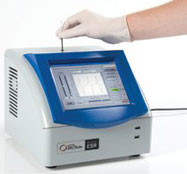
Figure 2 - Benchtop Micro-ESR spectrometer with integrated touchscreen. Dimensions: 11.25” × 10” × 10”.
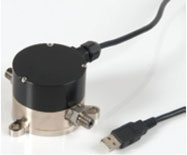
Figure 3 - On-line Micro-ESR sensor with 24-V dc power input and USB interface. Dimensions: 2.5” diameter.
The Micro-ESR sensor (Figures 2 and 3) has circumvented the limitations of conventional ESR spectrometers by using a small, strong rare-earth magnet assembly with a low-power 135-Gauss electromagnet coil and miniature wireless components. The conventional air-core cavity resonator was modified; the high-Q ceramic resonant cavity has a large “fill factor” compared to a conventional ESR. Thus, sensitivity remains acceptable while the volume of the entire device is reduced by a factor of 100.
Micro-ESR sensor technology has been incorporated into a portable, tabletop ESR spectrometer for academic and industrial users. The benchtop Micro-ESR spectrometer includes an integrated touchscreen, internal computer, thermoelectric cooler, and power supply (Figure 2).
The spectrometer uses capillary tubes inserted at the top or custom-sized borosilicate glass tubes for optimal sensitivity (2.3 mm o.d. × 2.0 mm i.d. × 100 mm long). The benchtop spectrometer is a complete system that is compatible with solid samples or liquid samples in any type of solvent. The spectrometer was designed for optimal sensitivity with water samples when using 2.0-mm-i.d. sample tubes.
The unit is easily portable. The case shown in Figure 2 is 11.25” × 10”× 10”, and includes the power supply, a thermoelectric cooler for temperature regulation, and an internal computer running Windows and Micro-ESR software. Power consumption is 80 W and weight is approximately 3 kg.
Additional benefits include small sample size (25–50 μL) and ease of use. No user adjustments to the bias, cavity coupling, or sample position are required in operation, greatly simplifying operation. These simplifications, combined with an intuitive graphical user interface, make ESR spectroscopy accessible to a broad user base of nonspecialists.
The on-line Micro-ESR sensor has fluid fittings for direct flow-thru applications (Figure 3). The sensor is only 2.5” in diameter and is interfaced via USB and a 24-V dc power input. It is approximately the size of a hockey puck.
Microwave spectroscopy is well suited to process applications because almost any type of sample can be analyzed. Crude oil, bunker fuel, used marine lubricants, and other tar-like samples can be analyzed continuously with no dilution or pretreatment.3,4 The sensor can handle high pressures and high-temperature fluid samples. An on-line application of the Micro-ESR sensor in real-time monitoring of the oxidation of engine oil is shown below.
Sensitivity

Figure 4 - Micro-ESR sensitivity measured for TEMPO in deionized water solutions at a concentration between 0.5 and 46 μM.
Several aqueous samples were measured using the Micro-ESR to demonstrate the performance of the first-generation sensor. 2,2,6,6-Tetramethylpiperidine-N-oxyl (TEMPO) is a common spin-label with a characteristic threeline ESR spectrum. Figure 4 shows the sensitivity of the spectrometer with TEMPO concentrations between 0.5 μM and 46 μM, using deionized water as the solvent.
Each spectrum is an average of 25 magnetic field sweeps with a total measurement time of approximately 15 min. The detection limit of the Micro-ESR spectrometer for TEMPO in water is about 0.5 μM under these conditions.
Applications
The following sections describe two industrial applications of Micro-ESR spectroscopy. The first example describes how the on-line Micro-ESR can be used for direct chemical measurements of degradation of engine and hydraulic oils.5 The second example is the on-line analysis of crude oil, in which asphaltene and vanadium content were measured in real time.6 Dozens of other applications of ESR exist that are not elucidated here, among them, spin trapping of reactive oxygen and nitrogen species in biomedical research;7–12 measurements of oxidative stability of vegetable oils, beer, wine, and other food products (including opaque emulsions);13–18 and analysis of carbon soot, coal, and other carbonaceous deposits. Radiation dosimetry and analysis of irradiated foods, plastics, and other solids are also common applications of ESR spectroscopy.
On-line oil condition monitoring
There are relatively few on-line sensor technologies for oil condition monitoring. Most sensors measure the physical properties of the oil (such as dielectric constant, viscosity, or electrical impedance) and then relate those data to underlying chemical changes in the oil. The physical-property approach fails in practice because no laboratory-derived model of oil degradation can properly account for the breadth of operating conditions found in the field. The presence of multiple factors can easily confound less sophisticated measurement techniques (for example, simultaneous fuel and water contamination of the oil), and no amount of data processing, computer modeling, or artificial intelligence can compensate for fundamentally flawed sensor data.

Figure 5 - ESR spectrum of stable free radicals generated from engine oil oxidation.
In contrast, the Micro-ESR spectrometer measures intrinsic chemical properties of the oil, i.e., the concentration of free radicals associated with oxidation. Measuring the population of stable free radicals generated by breakdown of the lubricant is a direct measurement of oxidation. As shown in Figure 5, new oil has no ESR spectrum; there are no free radicals, carbon, or other contaminants present in the oil. As the oil degrades, the free radical signal increases in intensity. Thus, the presence of any ESR spectrum clearly indicates that contamination is present in the oil. There is no need to calibrate the Micro-ESR against a sample of new oil.

Figure 6 - ESR spectra of crude oil.
Since the antioxidant package in the oil is depleted by oxidation, the intensity of the organic radical signal increases steadily from zero. This is the induction period. When the oil approaches the end of its useful life, the intensity of the organic radical signal increases dramatically and failure is imminent. Measuring free radical products in the oil gives a direct chemical indication of the onset of rapid oxidation.
Real-time analysis of crude oil
An example of Micro-ESR analysis of six crude oils is shown in Figure 6. The central peak at g = 2.00 is attributed to organic radicals, and a peripheral peak at g = 2.10 corresponds to vanadyl. By integrating the area under each peak, one can obtain the concentration of each compound. The limits of the current technology are 0.5% asphaltene and 5 ppm vanadium.
Conclusion
The Micro-ESR spectrometer has significantly reduced the size, cost, and complexity of ESR spectroscopy, making ESR feasible for nonspecialists. ESR is no longer limited to users who can access a central laboratory at a university. ESR spectroscopy is the only direct method to measure free radicals. For short-lived radicals, spin-trapping is a common technique used to evaluate the shelf-life of food products. The same spin-trapping technique is employed in biomedical R&D to measure oxidative stress. Industrially important process applications of the on-line Micro-ESR sensor exist in real-time monitoring of free radicals, lubricant condition, and crude oil analysis.
Please check out our Electron Spin Resonance Spectrometer / Electron Paramagnetic Resonance Spectrometer (EPS/ESR Spectrometer) section for more information or to find manufacturers that sell these products.
References
- Poole, C.P., Jr. Electron Spin Resonance: A Comprehensive Treatise on Experimental Techniques; John Wiley & Sons: New York, NY, 1983.
- Weil, J.A.; Bolton, J.R.; Wertz, J.E. Electron Paramagnetic Resonance: Elementary Theory and Practical Applications; John Wiley & Sons: New York, NY, 1994; pp 213–38.
- White, C.; Elliott, C.; White, J. In Micro-Electron Spin Resonance (ESR/ EPR) Spectroscopy, Proceedings of the SPIE Defense, Security & Sensing Conference, Next-Generation Spectroscopic Technologies III, Orlando, FL, Apr 2010; Vol. 7680.
- White, J.; White, C. Method and Apparatus for In-situ Measurement of Changes in Fluid Composition by Electron Spin Resonance (ESR) Spectrometry. U.S. Patent 11/983,393; filed Nov 8, 2007.
- White, C.; White, J.; Elliott, C. Unlocking free radicals with micro electron spin resonance. Practicing Oil Analysis Sept 2008, 23–6.
- White, J.; Giammateo, P. Measure vanadium, asphaltene concentration from the field. Hart Exploration and Production (E&P) Apr 2009, 103–4.
- Finkelstein, E.; Rosen, G.M.; Rauckman, E.J. Spin trapping of superoxide and hydroxyl radical: practical aspects. Archives Biochemistry and Biophysics 1980, 200(1), 1–16.
- Villamena, F.A.; Zweier, J.L. Detection of reactive oxygen and nitrogen species by EPR spin trapping. Antioxidants & Redox Signaling 2004, 3(6), 619–29.
- Roubaud, V.; Sankarapandi, S.; Kuppusamy, P.; Tordo, P.; Zweier, J.L. Quantitative measurement of superoxide generation and oxygen consumption from leukocytes using electron paramagnetic resonance spectroscopy. Anal. Biochem. 1998, 257, 210–17.
- Eaton, S.R.; Eaton, G.R.; Berliner, L.J., Eds. Biomedical EPR, Part A: Free Radicals, Metals, Medicine, and Physiology. In Biological Magnetic Resonance; Kluwer: New York, NY, 2005; Vol. 23.
- Goldstein, A.; Leute, R.K.; Ullman, E.F. Ligand Determination of Spin Labeled Compounds by Receptor Displacement-Amphetamine Analogs. U.S. 3,966,764; June 29, 1976.
- Bobst, A.M.; Hester, J.D. Detection of Nucleic Acid Sequences by Electron Paramagnetic Resonance Spectroscopy. U.S. Patent 7,125,665; Oct 24, 2006.
- Elias, R.J.; Andersen, M.L.; Skibsted, L.H.; Waterhouse, A.L. Identification of free radical intermediates in oxidized wine using electron paramagnetic resonance spin trapping. J. Agric. Food Chem. 2009, 57, 4359–65.
- Velasco, J.; Andersen, M.L.; Skibsted, L.H. Evaluation of the oxidative stability of vegetable oils by monitoring the tendency of radical formation. A comparison of electron spin resonance spectroscopy with the Rancimat method and differential scanning calorimetry. Food Chem. 2004, 85, 623–32.
- Velasco, J.; Andersen, M.L.; Skibsted, L.H. Electron spin resonance spin trapping for analysis of lipid oxidation in oils: inhibiting effects of the spin trap α-phenyl-N-tert-butylnitrone on lipid oxidation. J. Agric. Food Chem. 2005, 53, 1328–36.
- Kristensen, D.; Skibsted, L.H. Comparison of three methods based on electron spin resonance spectrometry for evaluation of oxidative stability of processed cheese. J. Agric. Food Chem. 1999, 47, 3099–3104.
- Kocherginsky, N.M.; Kostetski, Y.Y.; Smirnov, A.I. Use of nitroxide spin probes and electron paramagnetic resonance for assessing reducing power of beer. Role of SH groups. J. Agric. Food Chem. 2005, 53, 1052–7.
- Uchida, M.; Ono, M. Improvement for oxidative flavor stability of beer—role of OH-radical in beer oxidation. J. Am. Soc. Brew. Chem. 1996, 54(4), 198–204.
The authors are with Active Spectrum, Inc., 1191 Chess Dr. Ste. F, Foster City, CA 94404, U.S.A.; tel.: 650-610-0720; fax: 626-628-1970; e-mail: [email protected].