Featured Article
1Michael Riepl, 2Heather Graehl, 1Helena Funk, 3Ali Gawanbacht, 4Eva Klopocki, 5Reena Kartha
1Implen GmbH, Germany. 2Implen, Inc, USA. 3University Hospital of Ulm, Institute of Molecular Virology, Germany. 4Charité – Universitätsmedizin
Berlin, Germany. 5University of Minnesota, USA.
Please check out our Spectrophotometer section for more information or to find manufacturers that sell these products.
Introduction
Spectrophotometers allow for quantification of nucleic
acid and protein samples based on absorbance
at 260nm and 280nm, respectively. Traditionally this
method is performed in cuvette format which requires
large sample volumes generally from 100μl - 3500μl.
Technology advances have reduced sample volume
needed which is necessary in life science applications
where cost and sample availability are limited.

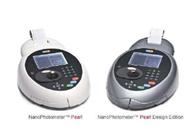
Fig. 1. Implen NanoPhotometer™ Pearl and NanoPhotometer™ Pearl Design Edition
Implen GmbH has developed the NanoPhotometerTM
Pearl (Fig. 1) to analyze ultra low sample volumes of
0.3μl while maintaining high accuracy, reproducibility
and speed. The NanoPhotometerTM Pearl has been
compared with respect to its performance characteristics
to those of the alternative technology, the Thermo
Scientific NanoDrop 2000c. The tests were designed
to evaluate very low sample volume (0.3μl - 2μl) performance
on DNA and proteins together with sample
stability and overall speed of analysis.
Instrumentation
All tests were performed with freshly prepared samples
under laboratory conditions at room temperature
to avoid any thawing effects. The tests were performed
under the described conditions by the same
operator following the recommended operating procedures
to eliminate any sample handling bias.
NanoDrop 2000c data were provided from instruments
of Charité Berlin and University Hospital Ulm,
both of which are new and within the calibration period
(calibration check recommended every 6 months
by the manufacturer). The NanoPhotometerTM Pearl
was a new system and does not experience pathlength
drift therefore requires no calibration. The pipette
used was Eppendorf Research® plus variable
0.1μl - 2.5μl which was accurate for 0.3, 0.5, 1.0 and
2.0μl volumes and was within calibration period.
Submicroliter technology is made possible by reducing
the pathlength from traditional 1cm cuvette format
to 2mm, 1mm, 0.2mm 0.1mm, or 0.04mm with the
NanoPhotometer™ Pearl or 1mm to 0.05mm with the
NanoDrop 2000c. With understanding of Beer-
Lambert Law (wikipedia.org/wiki/Lambert_beer), a
wide detection range is possible without a need for sample dilution for readings over the linear range. The
NanoPhotometer™ Pearl has a submicroliter detection
range of 2 - 18,750ng/μl dsDNA and NanoDrop
2000c of 2 - 15,000ng/μl dsDNA.
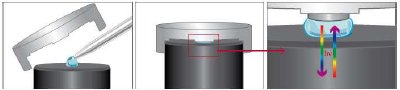
Fig. 2. Sample Compression Technology™ used in the NanoPhotometer™ Pearl.
The NanoPhotometer™ Pearl and NanoDrop 2000c
handle submicroliter volumes by completely different
approaches. The NanoPhotometer™ Pearl employs
Sample Compression Technology™ (Fig. 2 and
implen.com/ nanophotometer/how-it-works.php) while
the NanoDrop 2000c forms a surface tension dependent
column (nanodrop.com/HowItWorks.aspx).
DNA Quantification

Table 1. Fish Sperm dsDNA measured on NanoPhotometer™ Pearl and NanoDrop 2000c. Readings were performed ten times and averaged.
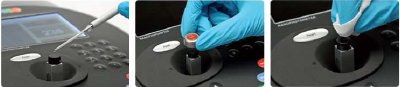
Fig. 3. Handling of NanoPhotometer™ Pearl

Fig. 4. Reproducibility of Fish Sperm dsDNA measurement and concentration calculations on NanoPhotometer™ Pearl and Nano-Drop 2000c.
A nominal 218ng/μl fish sperm dsDNA (Sigma) test
sample was measured 10 times on both systems by
applying a new sample each time to compare accuracy
and reproducibility (Table 1, Fig. 3 + 4). A sample
volume of 0.3μl, 1.0μl, and 2.0μl was used for the
NanoPhotometer™ Pearl and 0.5μl, 1.0μl and 2.0μl
for the NanoDrop 2000c.
The NanoPhotometerTM Pearl and the NanoDrop
2000c gave comparable results with 1.0μl and 2.0μl
sample volumes with the NanoDrop 2000c having
slightly higher standard deviation. Reproducibility
differences are clear in smaller volumes when Nano-
Drop 2000c showed significant fluctuation in values
with 0.5μl while the NanoPhotometer™ Pearl has reproducibility
down to 0.3μl (Table 1, Fig. 4). The Nano-
PhotometerTM Pearl is able to measure down to
25ng/μl of dsDNA with a sample volume of 0.3μl while
the NanoDrop 2000c using a 0.5μl sample volume
measures down to 150ng/μl illustrating therefore that
the NanoPhotometerTM Pearl is also significantly more
sensitive with low volumes.
Protein Quantification

Fig. 5. Comparison of measurements from NanoPhotometer™ Pearl and NanoDrop 2000c with high protein concentrations (59.8mg/ml) and 0.5μl sample volume.
A nominal 59.8 mg/ml of a BSA (BDH Prolabo) sample
was measured 10 times on both systems by applying
a new sample each time to compare accuracy and
reproducibility for 0.5μl sample volumes (Fig. 5, Table
2). A second set of samples was measured which had
been diluted with Glycerol (10%) (Fig. 6, Table 2).
Glycerol is a common stabilizing agent and also aids
dispensing. The buffer used was 1xPBS for both samples
and blank.
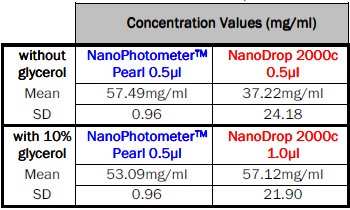
Table 2. BSA in 1xPBS without (BSA: 59.8mg/ml) and with (BSA: 52.6mg/ml) glycerol measured with Nano- Photometer™ Pearl and NanoDrop 2000c

Fig. 6. High BSA concentration (52.6mg/ml) measurements with NanoPhotometer™ Pearl and NanoDrop 2000c containing 10% glycerol.
The NanoDrop 2000c showed significant variation
for BSA samples with 0.5μl volume (Fig. 5) therefore
the sample was diluted with glycerol and 1.0μl sample
volume was used (Fig 6). Although 1.0μl improved the
performance on the NanoDrop 2000c the results were
still variable. In the tests the NanoPhotometerTM Pearl
has performed more reproducibly.
Stability over Time

Fig. 7. Signal stability of the NanoPhotometer™ Pearl and NanoDrop 2000c with dH2O blank measured at 260nm (dsDNA) and 280nm (BSA) over 60 seconds. The values were normalized to a pathlength of 1mm.
To establish reading stability over time, measurements
on the same applied sample are performed
over 60 seconds in 15 second increments. First a
blank and sample of deionized water (dH2O) were
measured over time (Fig. 7), and secondly a normal
procedure of blank and then dsDNA were measured
over time. Sample volumes were 1.0μl.

Fig. 8. Signal stability of NanoPhotometer™ Pearl and NanoDrop 2000c. The dsDNA sample was applied once and was measured at 0sec, 15sec, 30sec and 60sec.
The blank stability on the NanoPhotometerTM Pearl
is superior which is due to the low noise dual detector
based optical system. The NanoPhotometerTM Pearl is
also shown to be significantly more reproducible
measuring the same applied sample over time when
compared with the NanoDrop 2000c. A system with
poor sample stability requires care when reporting
data and replicates should be performed on a regular
basis to confirm the analysis. With the DNA sample
the NanoDrop 2000c showed a steady increase in
concentration over time which may be due to evaporation
as the sample is exposed to the environment
during measurement. With the NanoPhotometerTM
Pearl the sample is enclosed under a lid to minimize
evaporation and to prevent contamination. The sample
may also be recovered if required for further
analysis.
Speed of Analysis
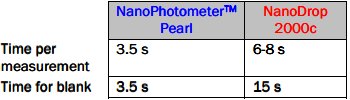
Table 3. NanoPhotometer™ Pearl and NanoDrop 2000c speed of analysis measured by stopwatch.
The NanoPhotometerTM Pearl and the NanoDrop
2000c were timed from switch on to being ready for
analysis, the time to take an individual reading, and
the time taken to measure a blank (Table 3). The time
required to clean the optical surfaces between samples
was the same for both instruments.
The NanoPhotometer™ Pearl is faster with both
sample and blank measurements as compared to the
NanoDrop 2000c. Furthermore with the NanoPhotometer
™ Pearl’s mobile stand alone character it is
ready to use after 5 sec of turning on. Since the
startup time of the NanoDrop 2000c is mainly depending
on the boot up time of the connected PC and
corresponding application software, it is significantly
longer. The NanoPhotometer™ Pearl, though capable
of connecting to a computer, has an onboard display
and can be configured with a thermal printer for direct
printing or an SD card module for measurement data
storage.
Conclusion
Submicroliter performance of the NanoPhotometer
™ Pearl and NanoDrop 2000c was evaluated with
regard to accuracy, reproducibility, sample stability,
and speed of operation. In DNA analysis, the Nano-
Photometer™ Pearl and Nanodrop 2000c both performed
well with sample volumes of 1.0μl and above.
At 0.5μl the NanoDrop 2000c showed a significant
higher standard deviation of the results compared to
the NanoPhotometerTM Pearl. Only the NanoPhotometer
™ Pearl was reproducible in volumes down to 0.3μl.
With protein analysis, the NanoPhotometer™ Pearl
was accurate to reference protein concentration and
reproducible with very low standard deviation. The
NanoDrop 2000c performed on protein analysis with
high variability. Increasing sample volume and adding
glycerol did not significantly improve the high variability
with the NanoDrop 2000c.
Stability over time is superior with the NanoPhotometer
™ Pearl both in regards to signal stability observed
with the blank and less deviation of repeated
measurements of the same applied sample over time.
Operation time was also shown to be less with the
NanoPhotometer™ Pearl in every category.
Please check out ourSpectrophotometersection formore information or to find manufacturers that sell these products.
Acknowledgements
The support of the University Hospital of Ulm and Charité – Universitätsmedizin
Berlin in this study is greatly appreciated.
NanoPhotometer™ Pearl and Sample Compression Technology™ are trademarks
of Implen GmbH and Implen, Inc.
NanoDrop™ is a trademark of Thermo Fisher Scientific.
Contact at Implen: Dr. Helena Funk [email protected]