Featured Article
A platform that covers this range of wavelengths can analyze materials for many applications, from biology to medicine
“In an ideal world, spectrophotometers would be capable of measuring the entire electromagnetic spectrum on a single instrument platform, generating a variety of types of information from the sample,” says Ian Robertson, IR/NIR applications chemist at PerkinElmer (Seer Green, U.K.). “In practice, this is not achievable, as the sampling requirements for the different spectral ranges are significantly different.” The typical ranges are ultraviolet (UV), visible (VIS) and near-infrared (NIR), which cover the wavelengths 190–400, 400–765 and 765–3200 nanometers, respectively.
A spectrophotometer illuminates a sample with light of a particular wavelength, or wavelengths, and then measures what is reflected or absorbed. A graph of absorption versus wavelength creates a spectrum that characterizes a sample.
To use a particular range of wavelengths, a spectrophotometer needs specific characteristics. “Mid-infrared sampling is generally performed with sample pathlengths in the range of 10–200 micrometers, whereas UV sampling is in the range of several millimeters,” explains Robertson.
Some platforms allow combinations of ranges, such as UV/VIS or IR/NIR. Some even allow UV/VIS/NIR. “UV/VIS/NIR spectrophotometry enables a wide variety of biological, chemical, physical and optical measurements over a large wavelength range,” says Andrew Hind, general manager–molecular spectroscopy at Agilent Technologies (Santa Clara, Calif.). “A combination of a versatile sample compartment and a wide accessory range permit a broad variety of sample types, and high optical performance enables measurement of both low and high absorbances.” He adds, “Key application areas range from optics/photonics, thin films/coatings and photovoltaics to the measurement of highly turbid biological solutions.”
Today, a variety of vendors offer UV/VIS/NIR platforms.
A sample of selections
Rather than stick with a limited range of illumination, many manufacturers provide more versatility, but that takes advanced engineering of some of the typical parts: light source, dispersion device, sampling area and detectors. “Various optical components—or external optics—are also necessary to transfer the light from the source, to the sample, and finally to the detector,” Hind explains. “In recording—or scanning—spectrophotometers, a double-beam design is generally used to permit measurement with continuous change in wavelength. In this type of instrument, both a sample beam and a reference beam—blank—are monitored continuously, so that absorbance, or transmittance, can be calculated at each wavelength.”
 UV/VIS/NIR methods can analyze a wide range of materials, including those that resist bacterial infection. (Image courtesy of Pacific Northwest National Laboratory.)
Many of the parts impact the performance. “From a design perspective, a spectrophotometer is a complex combination of optics, mechanics and electronics engineered to give high photometric performance over a particular absorbance and wavelength range,” according to Hind. “Photometric performance is determined by a number of factors, but is largely dependent on the monochromator—the heart of any spectrophotometer.” Despite its name, a monochromator produces a band of light. “A second monochromator can be used to further enhance performance through increased resolution, reduced aberrations and lower stray-light levels,” Hind notes.
This makes for a complex device. As Hind says, “From an engineering perspective, a UV/VIS/NIR spectrophotometer is a complex and challenging beast!” Robertson agrees, saying that it takes a precise optical design to ensure “the best performance throughout the spectral range without observing any spectral discontinuities when switching from one optical component to another.” A few of the available platforms are briefly described here.
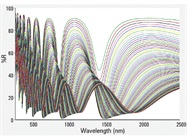
 The absolute specular reflectance of a coated silicon substrate in the UV/ VIS/NIR was measured from a 6 to 86° angle-of-incidence in 1° increments with p-polarized light. (Image courtesy of Agilent Technologies.)
The PerkinElmer LAMBDA 1050 UV/VIS/NIR spectrophotometer is designed to analyze a range of materials, including optical coatings and thin-film filters. It includes two sampling compartments and can be customized with various accessories to accommodate specific applications.
Agilent Technologies also makes a series of platforms in this market, including the Cary 7000, which covers the 175–3300 nm range. These platforms can also be customized—the Cary 7000, for example, is equipped with a universal measurement accessory that enables fully automated measurement of absolute reflectance and transmission at any angle.
For those who want to develop their own devices, HORIBA (Kyoto, Japan) makes UV/VIS/NIR spectrophotometers, such as the VS-7000-CCD, for original equipment manufacturers. Its CP20 is made for space-limited applications, including handheld devices.
“The key technological challenge with any UV/VIS/NIR spectrophotometer is the seamless integration of multiple light sources, multiple diffraction gratings and multiple light detectors into an optically and electronically ‘quiet’ system,” says Hind. When looking for a spectrophotometer, he says that the key specifications should be “spectral resolution, wavelength accuracy and precision, photometric accuracy and precision, low stray light and noise, high stability and wide linear dynamic range.”
Ups and downs
Although Robertson says that “any combination allowing a wider spectral range to be measured can only be positive,” he adds that “the combination can only be achieved on a high-performance spectrophotometer platform.”
At the Cornell Center for Materials Research (Ithaca, N.Y.), Steve Kriske oversees the use and maintenance of a UV-3600 UV/VIS/NIR spectrometer (Shimadzu Scientific Instruments, Columbia, Md.). As for the benefits of combining this range of wavelengths, Kriske says that, “Depending on the application, this platform is very convenient for researchers who need to measure one sample over a wide spectral range, or measure a variety of samples over a variety of narrower ranges.” He adds, “From a facility perspective, the cost and space-savings can be significant in comparison to using multiple spectrometers with narrower ranges.”
Use of these platforms relies heavily on the operator interface. Consequently, the devices come with software to run a range of applications, and manufacturers develop custom software when needed.
When asked if there are any disadvantages to combining so many wavelengths, Kriske said, “The greater complexity can be a hurdle for novice users because certain instrument parameters need to be optimized for the spectral range in use in order to acquire optimal data. … Fortunately, some of these parameters can be iteratively adjusted throughout a spectral scan by the control software.”
A range of applications
The spread of the illuminating spectrum allows more applications. In some cases, this combines nature with advanced technology. In the September 2, 2015 ACS Applied Materials & Interfaces, researchers described work on developing bacteria-battling surfaces.1 The scientists sought to develop a surface that bacteria couldn’t attach to. They used rice leaves as their model—making rice leaf-like surfaces (RLLS). The team characterized the surfaces with UV/VIS/NIR spectrophotometry, and reported that: “RLLS surfaces showed exceptional bacterial anti-adhesion properties with a >99.9% adhesion inhibition efficiency.”
UV/VIS/NIR platforms help scientists analyze a range of materials. Researchers used the technology to develop a method for analyzing single-wall carbon nanotubes (SWCNTs)2 in various applications. They concluded: “[The] wavelength range between 300 nm and 600 nm should be the most suitable for evaluation of the total concentration of dispersed SWCNTs in the suspension; also, wavelengths below 800 nm should be most suitable for evaluation of the concentration of individually dispersed SWCNTs in the suspension.”
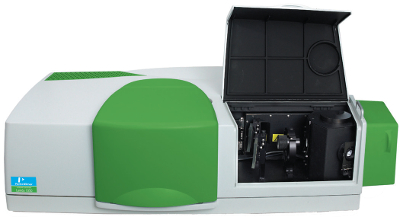 The LAMBDA 1050 UV/VIS/NIR spectrophotometer can analyze optical coatings, thin-film filters and many other materials. (Image courtesy of PerkinElmer.)
Many biological and medical applications benefit from related forms of technology, such as UV/VIS/NIR spectroscopy. As one group of scientists reported: “Label-free-based detection is pivotal for real-time monitoring of biomolecular interactions and to eliminate the need for labeling with tags that can occupy important binding sites of biomolecules.”3 They added that UV/VIS/NIR spectroscopy is one of the simplest forms of label-free detection, and that it can be used to “monitor immobilization and interaction of biomolecules with their corresponding partners.” The researchers developed biosensors composed of a gold (Au)-coated polycarbonate platform to detect erythropoietin (EPO), which has been used by athletes as a performance enhancer. UV/VIS/NIR spectroscopy was used to track the interaction between EPO and the biosensor. The team stated: “Au-coated polycarbonate could be an ideal biosensor platform for monitoring biomolecular interactions using UV/VIS/NIR spectroscopy.” Also, the technology could be miniaturized for easy use in the field, where it could “be applied towards detecting EPO abuse among athletes.”
The above examples give only a brief introduction to the range of applications for UV/VIS/NIR platforms. Today’s state-of-the-art technology also alludes to Robertson’s ideal world, where one day scientists will use a single device to explore the entire electromagnetic spectrum.
References
- OH, J.K.; Lu, X. et al. Bacterially antiadhesive, optically transparent surfaces inspired from rice leaves. ACS Applied Materials & Interfaces 2015; doi: 10.1021/acsami.5b05198.
- Yang, B.; Ren, L. et al. The characterization of the concentration of the single-walled carbon nanotubes in aqueous dispersion by UV-Vis-NIR absorption spectroscopy. Analyst 2013; doi: 10.1039/c3an01129a.
- Citartan, M.; Gopinath, S.C. et al. Use of UV-vis-NIR spectroscopy to monitor label-free interaction between molecular recognition elements and erythropoietin on a gold-coated polycarbonate platform. Talanta 2014; doi: 10.1016/j.talanta.2014.03.043.
Mike May is a freelance writer and editor living in Florida. He can be reached at [email protected].