Featured Article

The successful introduction of recombinant-DNA (r-DNA) technology for the manufacture of protein pharmaceuticals was aided by a close collaboration between the FDA, industry, and academia. An early example was the FDA-USP Workshop on Drug and Reference Standards for Insulin (1982) and a new analytical technique called high-performance liquid chromatography (HPLC) that supplied key technology for the analysis of protein purity and identity1-3 as well as sequence by peptide mapping.4,5 Subsequently, other analytical techniques such as capillary electrophoresis, isoelectric focusing, hydrophobic interaction chromatography, and mass spectrometry became available to provide orthogonal methods for more comprehensive characterization of the drug product.6 To illustrate the ongoing development of analytical technologies, we selected examples of early drug approvals—namely insulin, growth hormone, and DNAse, as well as recent product characterizations that are based on the application of advanced mass spectrometric methods—to illustrate the power of MS-based approaches.
Insulin
The discovery, development, and commercialization of insulin, a 51-amino acid peptide hormone secreted by the pancreas and used to treat diabetes, spans a period of approximately 100 years. It was discovered in 1921, the first patient was treated in January 1922, and adequate supplies were commercially available throughout most of the western world by the end of 1923. For the first 30 years of its commercial use, the insulin structure, including its amino acid sequence, was unknown, and the quality of the material was largely determined by biological assays in rabbits or mice. In the early 1950s, insulin was the first protein for which the complete amino acid sequence was determined, a milestone achievement.7 In combination with the discovery of the structure of DNA, this paved the way for the biotechnological revolution that began in the mid-1970s.
A historical review of the analytical controls for insulin during its first 50 years was published in 1974.8 At that time, biological assays were still the mainstay for control of product quality and were supplemented by radioimmunoassay and a variety of physicochemical techniques such as paper chromatography, paper and polyacrylamide gel electrophoresis, and gel filtration chromatography.
For the first 60 years of commercial use, insulin was extracted from the pancreas of swine and cattle, which differ from the human sequence by only one and three amino acids, respectively. With the advent of r-DNA technology, human insulin manufacturing became possible, and in 1982, Humulin (Eli Lilly, Indianapolis, IN) was the first therapeutic product manufactured using r-DNA technology to be approved for human use.9 While biological assays were still used to confirm biological activity of the product, additional analytical tools including reversed-phase high-performance liquid chromatography (RP-HPLC), Laemmli sodium dodecyl sulfate-polyacrylamide gel electrophoresis (SDS-PAGE), analytical ultracentrifugation, and fast atom bombardment mass spectrometry were available to more definitively establish purity and confirm structure.10,11 Monoclonal and polyclonal immunoassays were also established to demonstrate purity for specific process-related substances (e.g., host cell proteins, processing enzymes, etc.).
Figure 1 depicts the high degree of selectivity that RP-HPLC provided for characterization of the insulin variants at the time of the Humulin launch. In the subsequent 35 years since this first biopharmaceutical product was introduced, advances in analytical technology have been extremely impressive and have enabled development of tailored biopharmaceuticals, including a wide range of insulin analogues having modified duration of pharmacological action to facilitate more precise management of diabetes patients. RP-HPLC assay times have been greatly reduced. HPLC-MS in its various forms has reduced the time required to determine the peptide sequence from several days or even weeks to a few hours or less, and with much greater data clarity and certainty.
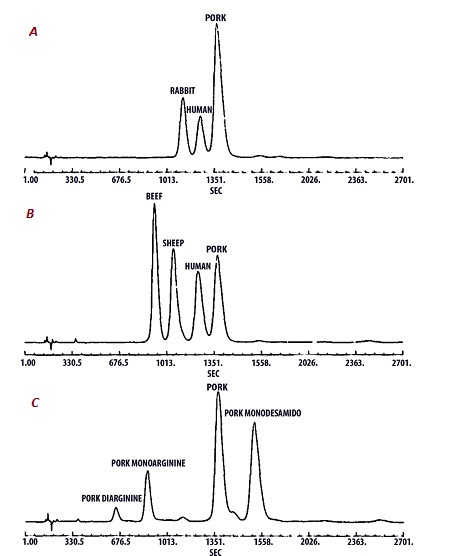 Figure 1 – HPLC elution profiles for various mixtures of pancreatic insulins and insulin derivatives: A) rabbit, human, and pork insulins; B) sheep, beef, human, and pork insulins; and C) diarginine and monoarginine pork insulins, pork insulin, and monodesamido pork insulin. (Figure adapted from Ref. 11 and see this article for experimental details.)
In one recent paper, ultrahigh-performance liquid chromatography-electrospray ionization-mass spectrometry (UHPLC-ESI-MS) was used to determine the sequence variations in a number of novel insulin analogues with a total assay time of less than 60 minutes.12 The much greater sensitivity and specificity of HPLC-MS, in combination with advances in immunoaffinity extraction techniques, has also made possible the determination of insulin as well as insulin analogues and degradation products with exquisite specificity in biological fluids at pharmacologically relevant concentrations.13-15
Insulin exists as a Zn hexamer in solution, a physiologically relevant attribute. Initially, this attribute caused great confusion in determining the molecular weight of the peptide monomer, which was believed to be about 12,000 daltons at the time of the initial sequence determination in the 1950s and was not fully understood for many years thereafter. Improvements in analytical ultracentrifugation allow more definitive determination of the solution phase polymorphic species, and ion mobility mass spectrometry16 and electrospray mass spectrometry17 have been used to rapidly determine the polymorphic species of insulin in solution.
Growth hormone
Pituitary-derived growth hormone was used from the 1950s to treat growth hormone deficiency but was discontinued due to the emergence of Creutzfeldt-Jakob syndrome in many of the patients. This observation was made at the same time as the discovery of prions as an infective agent and, as a result, a cadaver source was recognized to be an unsafe supply of the hormone. This presented an interesting challenge to the regulatory agents as the biotechnology industry was at an early stage of development and without an extensive safety record. For the accelerated review and approval of recombinant-DNA-derived growth hormone Protropin (Roche, Basel, Switzerland), RP-HPLC played an important role in the development of an assay for both the intact protein as well as a tryptic map.18,19 For example, RP-HPLC analysis of the intact protein showed that the E. coli-derived material, while containing an additional N-terminal methionine, was of a higher level of purity than a sample of the pituitary-derived material (Crescormone, Kabi AB, Uppsala, Sweden).6 Future developments allowed the separation of oxidized material, generated in a stability study,20 as well as a degradation product with deamidation at residue 152, which is part of a labile asparaginyl-glycine sequence.21 The analysis resulted in the identification of an isoaspartyl residue as the major product formed via a succinimide intermediate and was recognized as a potentially immunogenic degradation reaction.22
In these peptide mapping studies, a trypsin digestion was used to prepare a suitable mixture of peptides for separation by RP-HPLC.19 The tryptic map allowed the comparison of different manufactured lots and the release of material on the basis of no new peaks in terms of comparison with reference material. The tryptic map also enabled monitoring of both deamidation and oxidation degradations, with the observation of corresponding shifts in retention time of the degraded peptides.22 In this manner in the early days of biotechnology, before the advent of mass spectrometric methods, it was possible to use HPLC-based analytical methods to characterize the intact protein as well as digests and degradation products.
During the past decades, analytical technologies have undergone rapid development as exemplified in the approval of follow-on and biosimilar products. The characterization of the tryptic map by LC/MS provides a robust method to identify a wide range of generic products, including counterfeit versions.23 Further analytical power is achieved by top-down analysis of intact protein samples with a high-resolution mass spectrometer (Fourier-transform ion cyclotron resonance, FTICR). As is shown in Figure 2, variants such as two-chain, oxidized, and deamidated forms were identified via the mass shift of the degraded samples with comparison to the reference material.24
 Figure 2 – A) Deconvoluted spectra of hGH standard and hGH degradation products. Intact mass and any mass shift is labeled in each panel: a) reference material; b) four-week stability sample—peak 2 had mass shift of –31 Da, peak 3 had mass shift of –4 Da, peak 4 had mass shift of +1 Da due to deamidation, and peak 5 had mass shift of +17 Da in addition to the +1 Da due to deamidation, which might be due to oxidation; c) eight-week stability sample, which had the same peak profile as (b); d) two-chain sample—peak 9 was the uncleaved form and peak 10 was the cleaved form; the +18 Da mass shift was due to the addition of H2O caused by the cleavage reaction; e) oxidized sample—peak 11 had mass shift of +32 Da, meaning the addition of two oxygen atoms. B) Analysis of methionine oxidation in hGH oxidized sample using top-down method under reduced condition. Blue arrows indicate the site of fragmentation, up arrows stand for b ions, and down arrows stand for y ions. Amino acids with yellow boxes are ones that could be oxidized. (Figure adapted with permission from
 Anal. Chem.
2018, 89, 23, 12771–7. Copyright 2018 American Chemical Society.)DNAase
Recombinant human deoxyribonuclease (rhDNase) was approved by the FDA in 1993 for the treatment of cystic fibrosis as Pulmozyme (Genentech, So. San Francisco, CA). As one of the early recombinant protein drugs, the history of the development of rhDNase illustrates the advances in scientific methods that enabled the birth of the biotechnology industry, and validates the observation made well over 100 years ago by the discoverer of chromatography, Mikhail Tswett. In particular, the history of the development of rhDNase demonstrates the key role of advances in analytical methods in the 1980s and 1990s that were critical to the development of rhDNase and enabled the establishment of recombinant proteins as pharmaceuticals that have improved the lives of millions of patients and their families over the last 50 years. This brief review highlights a few of the unexpected findings both in the characterization of rhDNase and in the methods for that characterization that show the power of analytical biotechnology.
DNase is a 260-amino acid metalloenzyme that randomly cleaves DNA to small oligonucleotides. The crystal structure of DNase has been solved25 and shows the amino acid residues that comprise the binding site of the protein with its substrate. In rhDNase, the amino acids within the binding site include asparagine position 74 (Asn-74). Asparagine residues are prone to deamidation under alkaline conditions, including the conditions used for cell culture, and early in development it was discovered that this residue underwent deamidation during production in the bioreactor. The initial observations of deamidation were made by isoelectric focusing which, while not quantitative, showed high levels of acidic species that were generated during the course of a culture. The acidic species were shown by tryptic mapping and Edman sequencing of isolated peptides to arise from deamidation at Asn-74. Since the Asn-74 residue in the substrate binding site deamidated to acidic aspartate and iso-aspartate residues (and the susbtrate, DNA, is a polyanion), the enzymatic activity of rhDNase was reduced by deamidation, which made the degradation event significant, requiring control in the manufacture and development of the product. To achieve this, a quantitative tryptic mapping method was developed and employed to monitor production. Although tedious, the method was employed for the early and mid-stages of development of rhDNase, albeit with concerns about the throughput and reproducibility of tryptic mapping as a potential quality control method.
Fortunately for the development of rhDNase, and for the efficiency of the QC labs, Werner Müller of E. Merck (Darmstadt, Germany) invented and introduced “tentacle” cation-exchange packing materials. These packings could be used as mimics of the rhDNase substrate26 and, as shown in Figure 3, were able to effect a baseline separation of deamidated from nondeamidated rhDNase. This method was fast and reliable and became a workhorse for the monitoring of protein production and characterization. This illustrates the extremely high resolving power of such “biomimetic interaction chromatography” since the two forms of the 43-kDa protein can be resolved on the basis of a single charge difference, as long as it is present in part of the protein that binds to the stationary phase.
 Figure 3 – Tentacle cation-exchange chromatography of A) rhDNase, B) its deamidated variant, and C) an admixture of the two variants. Fractions 1 and 2 were collected and run on a pH 3–5 isoelectric focusing gel shown in (D). (Figure adapted with permission from https://doi.org/10.1016/0021-9673(93)83009-H. Copyright 2018 American Chemical Society.)
DNase I is a glycoprotein that is secreted by the pancreas to break down DNA. Human DNase contains two glycosylation sites at Asn-18 and Asn-106 (3). Bovine DNase (bDNase) had previously been studied extensively, in part because of its early use as a treatment for cystic fibrosis. bDNase glycosylated only at Asn-18 and carries high-mannose and sialic-acid-containing hybrid glycans at that site. During the development of rhDNase, we determined that it was glycosylated similarly to hDNase, but that removal of sialic acid from the protein with neuraminidase treatment did not eliminate the charge heterogeneity of the oligosaccharides, as it did for bDNase. The remaining charge heterogeneity of these structures was due to an unexpected occurrence of mannose-6-phosphate (Man-6-P) on the high-mannose structures found at both sites of the glycoprotein. Man-6-P is a protein sorting marker for trafficking of lysosomal enzymes, so the occurrence of these structures on a secreted enzyme was unexpected. Due to the charge heterogeneity of the glycoprotein conferred by silylation, monitoring and characterization of phosphorylation were challenging. However, we determined27 that a polyethylenimine (PEI) anion exchange column was able to provide near-baseline resolution of different forms of rhDNase differing only in the number and location of Man-6-P structures on the glycoprotein, as shown in Figure 4. This method, which also shows the exquisite selectivity that can be obtained by chromatography, was useful in the monitoring and characterization of rhDNase in development.
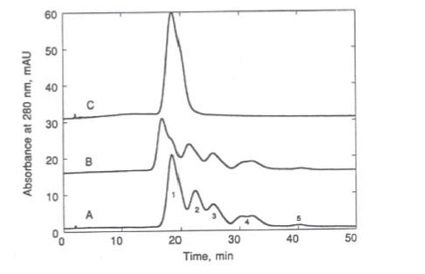 Figure 4 – Analysis of rhDNase samples by anion exchange HPLC with a PEI column. Prior to injection, samples were: A) untreated, B) digested with neuraminidase, or C) digested with alkaline phosphatase. (Figure adapted with permission from https://doi.org/10.1016/0021-9673(93)83009-H. Copyright 2018 American Chemical Society.
Although not essential for the development of rhDNase, the unexpected findings in characterizing rhDNase and the powerful methods developed for its characterization and purification led to fruitful collaborations that permitted solution of the rhDNase crystal structure28 and improved understanding of the determinants of Man-6 phosphorylation of lysosomal proteins.29,30 The UDP-GlcNAc:lysosomal enzyme N-acetylglucosamine-1-phosphotransferase that transfers Man-6-P to lysosomal enzymes recognizes widely dispersed markers on its substrates; rhDNase was a tool that furthered our fundamental understanding of these markers.
As these examples have shown, the developments in analytical biochemistry in the 1980s and 1990s accelerated or even enabled the production and characterization of products of the biotechnology industry such as rhDNase. These complex molecules offer rich vistas for novel discoveries in protein biochemistry. Novelty in pharmaceutical development can lead to delays caused by the need to thoroughly characterize the product to ensure consistent manufacture of the product through development and the commercial product lifecycle. The tools that were becoming available early in the establishment of the biotechnology industry permitted rapid understanding of the unexpected and minimized such delays. Hence, very early in the introduction of these products, a complex molecule such as rhDNase could already be declared “well-characterized”31 thanks to the advances in methods required for advances in the science.
Conclusion
The biotechnology field has seen progress from early analytical techniques such as HPLC to the development of on-line mass spectrometric measurements such as described here, in addition to a suite of other analytical techniques that together enable a comprehensive view of a protein therapeutic. Disadvantages of the use of mass spectrometry, despite the power of the measurement, are primarily the cost and resource-intensive nature of the instrumentation that is not compatible with highly distributed manufacturing of biological drugs. Recently, the Defense Advanced Research Projects Agency (DARPA) launched a program for the development of a platform for the portable production of biopharmaceutical treatments that aims to deliver drugs based on patient demand.32,33 To monitor such a distributed manufacturing system, one can see that traditional HPLC assays could play a central role for measuring product identity, purity, and concentration, as well as monitoring protein impurities and degradation products. These assays will be augmented by powerful next-generation assays based on techniques such as optical detection with Raman spectroscopy34 and electrokinetic concentration binding assays.35 American Laboratory has a promising future for reporting on advances in the field of analytical chemistry and the biopharmaceutical industry.
References
- Hancock, W.S.; Bishop, C.A. et al. Science 1978, 20, 1168–70.
- Chance, R.E.; Kroeff, E.P. et al. Diabetes Care 1981, 4, 147–54.
- Welinder, B.S.Homogeneity of Crystalline Insulin Estimated by GPC and Reversed Phase HPLC. CRC Handbook of HPLC for the Separation of Amino Acids, Peptides and Proteins; CRC Press: Boca Raton, FL, 1984, vol. II, pp. 413–9.
- Hancock, W.S.; Bishop, C.A. et al. Anal. Biochem. 1978, 89, 203–12.
- Schroeder, W.A. Protein Identification by Peptide Mapping. CRC Handbook of HPLC for the Separation of Amino Acids, Peptides and Proteins; CRC Press: Boca Raton, FL, 1984, vol. II, pp. 287–300.
- Hancock, W.S. HPLC in Biotechnology. John Wiley: New York, NY, 1990, pp. 1–19.
- Stretton, A.O.W. Genetics Oct 2002, 162, 527–32.
- Stewart, G.A. Analyst Dec 1974, 99, 913–28.
- Altman, L.K. A new insulin given approval for use in the U.S. The NY Times Oct 30, 1982.
- Chance, R.E. and Frank, B.H. Diabetes Care 1993, 16, Suppl 3, 133–42.
- Chance, R.E.; Kroeff, E.P. et al. Diabetes Care 1981, 4, 147–54.
- Yang, R.S.; Tang, W. et al. J. Am. Soc. for Mass Spectrom. May 2018, 29(5), 853–8.
- Van Der Gugten, J.G.; Wong, S. et. al. Methods Mol. Biol. 2016, 1378, 119–30.
- Chambers, E.E.; Fountain, K.J. et al. Anal. Chem. 2013, 86, 694–702.
- Thomas, A.; Thevis, M. et al. Anal. Chem. 2007, 79, 2518–24.
- Fávero-Retto, M.P.; Guerreiro, L.H. et al. Biologicals Jan 2017, 45, 69–77.
- Fabris, D. and Fenselau, C. Anal. Chem. 1999, 71, 384–7.
- Hormone Drugs. Proceedings of FDA-USP Workshop, U.S. Pharmacopeial Convention Inc., Rockville, MD, 1982.
- Kohr, W.J.; Keck R. et al. Anal. Biotech. 1982, 122, 348–59.
- Becker, G.W.; Tackitt, P.M. et al. Biotech. Appl. Biochem. Aug 1988, 10(4), 326–37.
- Johnson, B.A.; Shivokawa, J.M. et al. J. Biol. Chem. 1989, 264, 14262–74.
- Aswad, D., Ed. Deamidation and Isoaspartate Formation in Peptide and Proteins; CRC Press: Boca Raton, FL, 1995.
- Jiang, H.; Wu, S.-L. et al. Biotechnol. Prog. 2009, 25(1), 207–18.
- Wang, Y.A.; Wu, D. et al. Anal. Chem. 2017, 89(23), 12771–7.
- Wolf, E.; Frenz, J. et al. Prot. Eng. 1995, 8, Suppl. S, 79.
- Cacia, J.; Quan, C.P. et al. J. Chromatogr. 1993, 634, 229–39.
- Cacia, J.; Quan, C.P. et al. Biochemistry 1998, 37, 15154–61.
- Frenz, J.; Quan, C.P. et al. Anal. Chem. 1994, 66, 335–40.
- Nishikawa, A.; Gregory, W. et al. J. Biol. Chem. 1997, 272(31), 19408–12.
- Nishikawa, A.; Nanda, A. et al. J. Biol. Chem. 1999, 274(27), 19309–15.
- Quan, C.P.; Frenz, J. et al. Pharm. Sci. 1997, 3, 53–7.
- Love, K.R.; Dalvie, N.C. et al. Curr. Opin. Biotechnol. 2018, 53, 50.
- Perez-Pinera, P.; Han, N. et al. Nat. Commun. 2016, 7, 12211.
- Herrington, W.F.; Singh, G.P. et al. Sci. Rep. 2018, 8(1), 5089.
- Ouyang, W.; Ko, S.H. et al. Anal. Chem. 2016, 88(19), 9669–77.
Ralph Riggin is with Riggin Consulting, LLC, Eastvale, CA, U.S.A. John Frenz, Di Wu, and William Hancock are with the Chemistry and Chemical Biology Department, Northeastern University, 140 The Fenway, Boston, MA 02115, U.S.A.; tel.: 617-373-4881; e-mail: [email protected]; www.neu.edu