 Raman spectroscopy is a spectroscopic method of determining the vibrational modes of molecules, as well as other low-frequency modes, which is often used to provide a structural fingerprint for identifying molecules. Raman spectroscopy relies on Raman scattering, the inelastic scattering of photons, meaning that the energy being emitted by the photon is either higher or lower than the incident photon. This puts the molecule into a hybrid energy state for a brief period before the photon is emitted.
The way this works is by lighting a sample with a laser beam. The laser light causes a shift in energy in the molecule, and that provides insight into the vibrational modes of the system. What is called spontaneous Raman scattering is very weak, with the trouble coming in separating inelastically scattered light from very intense Rayleigh scattered laser light.
The Raman scattering (RS) spectra are one-dimensional plots that provide a fingerprint for analysis. With RS, incident monochromatic light produces peaks that are shifted by the phonon frequency. With Micro-RS, a microscope focuses light onto a sample and elastically scattered (Rayleigh) light is filtered out, allowing the scatter to be analyzed.
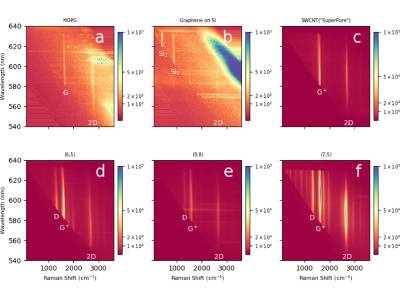
Now, researchers have shown that by using a simple setup of currently available optical equipment, they can map the spectra far more quickly than before and over a broader excitation range. This means that scientists can take better advantage of scattering resonance in order to create a Raman excitation map (REM), which is two-dimensional data that encodes spectra and their coupling. Previously, this was a time-consuming process but has now been made far more rapid. For their tests, the scientists mapped different forms of carbon, like graphite, graphene, purified single-walled carbon nanotubes (SWCNTs) and chirality enriched SWCNTs. The new technique is simple and quick, making it a practical tool for materials analysis.
The results of the study are published in the journal, Scientific Reports.
Photo: Raman excitation maps of some carbon materials. Credit: Finnie, P., Ouyang, J. & Lefebvre, J., Scientific Reports, CC BY 4.0