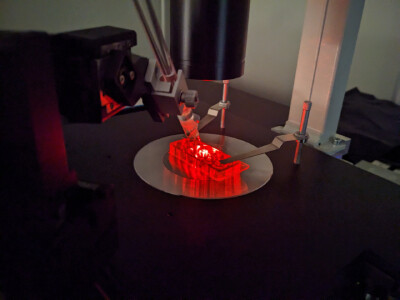
FITSA method Photo TalTech. Credit: TalTech
Estonian researchers have recently published a study which could revolutionize how fluorescence correlation spectroscopy (FCS) measurements are analyzed, potentially solving a 50-year-old problem in FCS analysis.
Their work, published in the journal Science Advances, addresses a longstanding statistical analysis issue with how autocorrelation is analyzed. Due to the noisy signals found at the molecular level during FCS analysis, researchers have long relied on autocorrelation analysis as a sort of fingerprint, revealing whether what is being observed is molecular movement, chemical reactions, particle size differences, or particle interaction. However, since all these autocorrelation values come from a single experiment, they are not truly independent measurements, making reliability assessments impossible.
To improve the autocorrelation analysis, experiments would need to be scaled to a level which is impractical at best, but often impossible. Thus, creating the dilemma of whether FCS should be used incorrectly or not at all.
Building on a research project by U.S. scientists from 6 years ago, the team developed a new method called FITSA, short for fluorescence intensity trace statistical analysis. FITSA is a robust methodology which offers quantitative analysis with much less data needed versus classical FCS, even when using FCS in its incorrect mode. When comparing FITSA with FCS used properly, FITSA requires 300 to 21,000 times less data.
Thanks to these huge differences FITSA opens new opportunities to study processes with scientific rigor not previously possible. The team envision the method ultimately replacing classical FCS.
While there are many practical problems to resolve with FITSA, the team is confident that they have demonstrated a major advantage in the form of direct experimental data analysis. Once optimized, FITSA could allow future researchers to study molecular environments and interactions in a significantly more precise manner.