Featured Article

Turbidity is one of many physical properties of biotherapeutics formulations monitored during drug discovery and development to assess drug stability. Above an inherent turbidity of the stable formulation in question, any increase in turbidity during storage or stress testing may indicate aggregation, precipitation, or decomposition pathways.
Rapid methods of turbidity screening are essential to an automated drug formulation development workflow. To support baseline and post-stress analysis of biopharmaceutical formulation development, KBI (Durham, NC) employed the Freeslate biologics formulation robotic workstation (Unchained Labs, Pleasanton, CA) to assist in sample preparation and analysis (Figure 1). The platform includes multiple liquid handlers, a robotic vial/plate gripper, plate shakers, temperature bays, plate storage carousel, pH meter, ultraviolet/visible (UV/VIS) spectrophotometer, capillary viscometer, and automated visual inspection station (VIS).
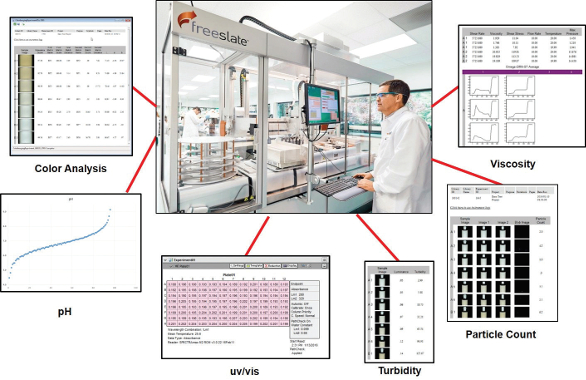 Figure 1 – Freeslate biologics formulation automated workstation.
For sample appearance testing, the robotic vial gripper places sample vials onto a stage in front of a digital camera for color, turbidity, and visible particle analysis. In this manner, three different data sources are derived from a single manipulation. The stage rotates to mix the vial contents and presents the vial in multiple orientations for data averaging. For turbidity, the images are digitally processed to correlate with calibration standards. However, this transmittance-based analysis is subject to error from other absorbance effects, notably sample color. Because many biologics formulation candidates have slight to moderate color, a modification of the Freeslate system was required to enable true nephelometric analysis of the samples.
Turbidity measurement
A transmittance-based turbidimeter accurately measures turbidity for particle-free, colorless samples. However, in the context of drug development, turbidity is more rigidly defined as the extent to which suspended particles of free or aggregated drug substance induce visible light scattering. To detect this effect without interference from suspended solids or sample color, a nephelometer is used. Nephelometry requires optics that position the detector at a 90° angle from the incident beam with respect to the sample. A second detector may also be positioned in line with the incident beam.1
In the Freeslate VIS, a brightfield LED light source is positioned directly in front of the sample, behind a diffuser screen, in line with the digital camera lens. A slit collimates the light to a narrow path to minimize glare and reflection. The image is captured by the digital camera and is processed to obtain a luminance value (L) for the sample. To enable nephelometric analysis on the Freeslate VIS, the device was modified to incorporate a 150-W halogen lamp (Cole-Parmer, Vernon Hills, IL) positioned at one side of the vial at 90° from the camera axis. The tungsten/ halogen lamp provides adequate incident wavelengths to promote strong scattering in protein solutions. A gooseneck fiber-optic bundle allows the light source to be precisely positioned beside the vial on the VIS sample stage. Figure 2 shows a schematic of the two methods (brightfield and scattered light detection modes).
 Figure 2 – Normal (brightfield) versus scattered light detection (SLD) modes for the Freeslate VIS.
In normal (brightfield) turbidity mode, the Freeslate VIS takes an image of the light source beam with no vial present to establish a “background” value for light transmittance (e.g., 100% T). The Freeslate calculates the luminance (L0) of the background image and then compares all measured samples to this reference. In this way, the effects of small fluctuations of lamp intensity over time are mitigated. The normalization equation used is:
LN = (L0 – L)/L0
Where LN = normalized luminance, L0 = luminance of reference, and L = luminance of sample.
Since the luminance of the reference will always be larger than that of the sample, the resulting LN will be a dimensionless number between 0 and 1. The resulting normalized luminance is then correlated with calibration data to calculate turbidity.2 In the modified (scattered light detection) method, a 200-NTU turbidity reference sample was used as a luminance standard to normalize all luminance measurements.
Bovine serum albumin (BSA) is often used as a model protein for analytical system development. Solutions of BSA are slightly turbid and brown-yellow in color, so this system was chosen to test the nephelometric modification of the Freeslate VIS. Solutions of BSA in phosphate-buffered saline (PBS) buffer were prepared and measured on the Freeslate VIS. These values were compared with a standard nephelometer.
Methods
Bovine serum albumin (Fraction V, cat. 2910, MilliporeSigma, St. Louis, MO) was dissolved in PBS buffer to achieve a concentration of approximately 75 mg/mL. The stock solution was filtered using a 0.22-μm syringe filter. Other solutions were made by diluting this stock solution to the target concentrations using the same diluent. Concentration of each standard was confirmed by UV/VIS at A280 (minus A320). The Freeslate VIS and a nephelometer were both calibrated using styrene divinylbenzene (SDVB) turbidity standards (AMCO Clear, GFS Chemicals, Powell, OH) at 0, 5, 10, 20, 40, and 100 NTU. For each sample, turbidity was measured on the nephelometer and also on the Freeslate VIS, in normal (brightfield) mode and scattered light detection (SLD) mode.
Results and discussion
The turbidity data collected for the BSA samples are presented in Table 1. The Freeslate VIS brightfield mode reported turbidity values that were considerably higher than those reported by the nephelometer. This expected result is due to light absorbance by the background color of the protein. The Freeslate VIS SLD mode reported turbidity values that were closer to the nephelometer values. Figure 3 shows an overlay plot of the reported turbidity values from all three sources. Equivalent performance was obtained with sample volumes ranging from 1 mL to 10 mL, and in vial sizes from 2-mL serum vials to 20-mL scintillation vials.
Table 1 – Reported turbidity for BSA samples from three sources
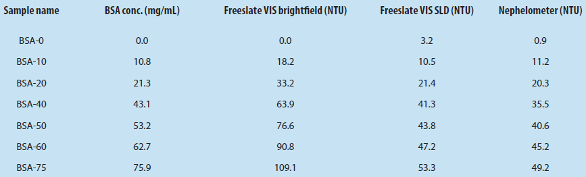
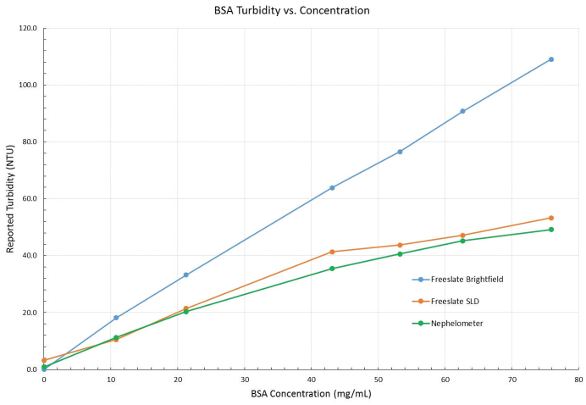 Figure 3 – Reported turbidity of BSA from nephelometer and Freeslate VIS (brightfield and SLD modes).
Conclusion
The Freeslate visual inspection station cannot discriminate between turbidity light scattering and other light absorption effects. In this study, the Freeslate VIS was modified to enable measurement of light scattered from a halogen light source positioned at 90° from the camera axis. The resulting reported turbidity compared well with the actual turbidity as measured by the nephelometer throughout the range of BSA concentrations that were tested. With accurate turbidity data, the Freeslate biologics formulation workstation provides rapid sample preparation and analysis to support drug discovery and development activities.
References
- Omar, A.; MatJafri, M. Turbidimeter design and analysis: a review on optical fiber sensors for the measurement of water turbidity. Sensors 2009, 8311–35.
- High-throughput visible particle, turbidity and color measurement of biologics formulations. Unchained Labs Application Note, 2016, Rev. A.
Daniel Kinder is senior scientist, Lab Automation, KBI Biopharma, Inc., 1101 Hamlin Rd., Durham, NC 27704, U.S.A.; tel.: 919-479-9898; e-mail: [email protected]; www.kbbiopharma.com