Featured Article
The structural characterization of biopharmaceuticals is typically performed using traditional spectroscopic methods such as Fourier transform infrared (FTIR) and circular dichroism (CD). These techniques, however, are not optimal for protein product development, particularly with respect to performing the measurement at the formulated concentration.
A new technique for characterizing the secondary structure of proteins that is uniquely well-matched to the demanding requirements of biotherapeutic development, Microfluidic Modulation Spectroscopy (MMS) (RedShiftBio, Burlington, MA) has the ability to measure with high sensitivity across an extremely wide concentration range.
Formulating proteins
The direct link between the structure and functionality of a biotherapeutic protein makes it essential to develop biopharmaceuticals that deliver the molecule with its target structure intact. Most biopharmaceuticals are delivered parenterally, with relatively high dosages required for clinical efficacy. Formulations with high drug concentrations are advantageous from the perspective of administration time, with buffers and excipients chosen to control stability and physical properties, especially viscosity, to facilitate injection or intravenous infusion.
In solution, proteins are prone to conformational change or instability, unfolding, or misfolding as structural bonds are disrupted by changes in the local environment. Changes in concentration or buffer composition, pH, and/or temperature, for example, can impact conformation and may also trigger aggregation, the joining together of either native or misfolded proteins. Any structural change has the potential to compromise efficacy and, in the worst case, impact safety, and must be understood and controlled. The development of an optimized formulation therefore relies on being able to sensitively detect changes in secondary and higher-order structure.
Closer scrutiny of this analytical requirement helps to identify techniques that are particularly well-matched to the formulation environment. Initial studies may be carried out at relatively low concentration, to conserve drug product, but as development closes in on a finished formulation, representative samples are necessarily more highly concentrated. Sample preparation adds complexity and time to the analytical process, introduces potential for variability, and, most importantly, may distort the structure of the protein. The extrapolation of measured results to higher concentrations is therefore highly undesirable.
Formulators use multiple analytical techniques to generate the knowledge base required to securely support a product to market. To analyze samples over a wide range of concentrations, it may be necessary to utilize different techniques. However, rationalizing datasets from different techniques and instruments is a major issue for the industry, and minimizing the number of systems in routine use is preferable, within the constraints of optimizing information flow. The capability to measure across the full concentration range of interest with no need for either dilution or preconcentration is a major advantage and offers significant benefits in terms of data integrity and analytical productivity.
The intense time pressures that accompany formulation mean that this need for highly sensitive and repeatable structural characterization across a wide concentration range comes with a requirement for streamlined measurement and easily interpreted data. Traditional presentations of vibrational spectroscopy do not meet these requirements.
Microfluidic Modulation Spectroscopy
Absorption in the IR region, more specifically in the Amide I band (wavenumber range 1600–1700 cm-1), provides a signature of the vibrational mode strength of carbonyl bonds in the peptide backbone, which in turn can be used to characterize secondary structure. Features of Amide I spectra have been correlated with the presence of α-helices and β-sheets and turns, along with other less prevalent structures such as random coils.1 In particular, IR is highly sensitive to the presence of β-sheet structure, making it especially useful for protein antibody drugs and the direct investigation of aggregate formation.2
For these reasons, FTIR spectroscopy is being widely used for protein characterization despite some recognized limitations. FTIR works optimally in the 10–150 mg/mL range,2 which can be problematic when there are only limited quantities of the molecule available and can exhibit relatively low sensitivity. Background drift can also be an issue, and close temperature control is required during measurement. Alternative spectroscopic methods include Raman, which has an even higher minimum concentration requirement, and CD, which works well at more dilute concentrations, typically operating in the range 0.2–to 2.0 mg/mL,3 but is unsuitable for direct measurement at high formulation concentrations. Furthermore, CD is relatively insensitive to changes in β-sheet structure, limiting its relevance for aggregation studies.
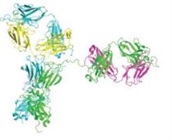
MMS harnesses the inherent advantages of IR spectroscopy in a setup that more fully addresses analytical requirements in formulation and throughout biopharmaceutical development. With MMS, continuously flowing sample and reference (matching buffer) streams are rapidly modulated (1–5 Hz) through a microfluidic cell to generate differential scans of the Amide I band (see Figure 1).
 Figure 1 – Modulating the protein sample with a matching water/buffer stream generates differential, autocompensated scans of the Amide I band, allowing MMS to characterize secondary structure with high sensitivity.
Modulation enables automatic background subtraction, eliminating the background drift associated with FTIR measurements and substantially improving signal-to-noise ratio. In addition, MMS systems use a tunable quantum cascade laser that generates an optical beam around 1000 times brighter than those of conventional FTIR instruments, increasing the concentration range over which samples can be reliably measured. This high-resolution, low-noise beam is configured such that simple detectors (with no cooling requirement) deliver label-free, high-sensitivity structural characterization across a concentration range from 0.1 to 200 mg/mL. Advanced data processing software transforms the raw spectra into easily interpreted structural information.
Figure 2 contrasts FTIR and MMS data for solutions of immunoglobulin (IgG1) spiked with bovine serum albumin (BSA). IgG1 has an almost exclusively β-strand secondary structure (86.5%),4 while BSA is predominantly α-helical (94.3%)5 (see Figure 3). In combination, these two proteins provide a useful model system for mimicking the introduction of structural impurity. Here, data were gathered for pure IgG1 and BSA, and for binary mixtures of the two proteins containing 2, 4, 6, 8, and 10% BSA, with overall protein concentration maintained at 20 mg/mL. All protein samples were supplied by Elion Labs (a division of KBI Biopharma, Louisville, CO). FTIR data were measured at ambient temperature using a mercury cadmium tellurium (MCT) detector with a resolution of 4 cm-1. MMS analyses were carried out using a modulation frequency of 1 Hz at a pressure of 5 psi and a transmission cell with a pathlength of approx. 23.8 µm (RedShiftBio AQS3pro preproduction unit with multisample automation). For more complete experimental details see https://redshiftbio.com/elion-labs-webinar/.
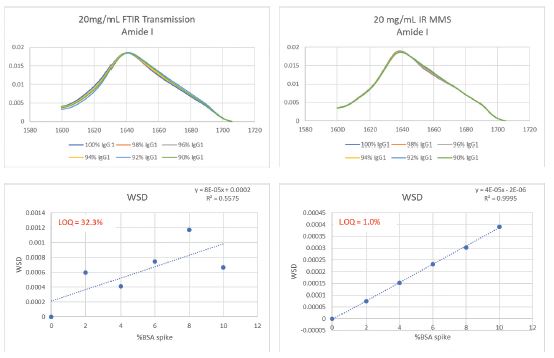 Figure 2 – Amide I spectra and plots of weighted spectral difference (WSD) as a function of BSA content demonstrate the sensitivity of MMS (right) relative to FTIR (left)
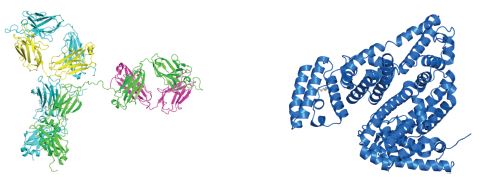 Figure 3 – IgG1 has a secondary structure comprised predominantly of β-strands (left), while BSA is almost exclusively α-helical (right).
 Both sets of Amide I spectra show evidence of change around the 1656 cm-1 and 1637 cm-1 wavenumbers associated with α-helix and β-strand structure, respectively. However, the lower plots, of weighted spectral difference (WSD) as a function of %BSA, show clearly that MMS produces much cleaner data and a significantly more robust, linear correlation. In fact, in this test, MMS demonstrated a 30-fold better detection of misfolded protein (BSA), a significant gain in sensitivity.
Conclusion
Biopharmaceutical formulation is an exacting challenge that relies on efficient structural characterization techniques. By directly addressing the limitations of FTIR, MMS more sensitively and repeatably quantifies the secondary structure of proteins across a far wider concentration range. It is therefore an effective solution for productive, representative structural analysis, both in formulation and throughout biopharmaceutical development and manufacture.
References
- Koenig, J.K. and Tabb, D.L. In Analytical Applications of FT-IR to Molecular and Biological Systems, Durig, J.R., Ed.; D. Reidel: Boston, 1980, pp 241–55.
- Wang, W. and Roberts, C.J. Aggregation of Therapeutic Proteins. Wiley: New York, NY, Aug 30, 2010.
- Kelly, S.M. and Price, N.C. The use of circular dichroism in the investigation of protein structure and function current protein and peptide science. Curr. Prot. Pept. Sci. 2000, 1(4), 349–84.
- Saphire, E.O.; Parren, P.W. et al. Crystal structure of a neutralizing human IGG against HIV-1: a template for vaccine design. Science 2001, 293, 1155–9. (pdb: 1HZH). Structure content from: http://www.uniprot.org/uniprot/P01857#structure.
- Bujacz, A. Structures of bovine, equine and leporine serum albumin. Acta Crystallogr. D Biol. Crystallogr. 2012, 68, 1278–89. PMID: 22993082 (pdb: 4F5S). Structure content from: http://www.uniprot.org/uniprot/P02769#structures.
Eugene Ma is chief technology officer, and Libo Wang is senior applications specialist, RedShiftBio, 131 Middlesex Tpke., Burlington, MA 01803, U.S.A.; tel.: 781-345-7300; e-mail: [email protected]; www.redshiftbio.com. Brent Kendrick is vice president, Elion Labs, Div. of KBI Biopharma, Louisville, CO, U.S.A.