In December 2018, the Farm Bill was signed into law in the U.S., which legalized hemp containing 0.3% or less of the psychoactive compound delta-9-tetrahydrocannabinol (THC) on a dry weight basis. With the passing of this act, as stated by the Virginia Department of Forensic Science, “the only mechanism to distinguish hemp plant material from marijuana plant material is to conduct a quantitative analysis to determine the tetrahydrocannabinol (THC) concentration of the plant material.”
Since then, cannabis has become legal for medical and recreational use in much of the U.S. and throughout Canada. Because desirable levels of cannabinoids differ for these various products, more accurate and sensitive analytical methods are needed for quantitative determination than the widely applied technique of high-performance liquid chromatography (HPLC) with UV and photodiode array detectors.
Therefore, liquid chromatography-mass spectrometry (LC-MS) is becoming increasingly recognized for the quantitative determination of cannabinoids, because it provides higher sensitivity, specificity and mass identification. We developed a quantitative LC-MS method using simultaneous in-source fragmentation (SID) for the identification of 16 cannabinoids, including ∆9-tetrahydrocannabinol (∆9-THC), ∆8-tetrahydrocannabinol (∆8-THC), cannabidiol (CBD), cannabigerol (CBG), cannabinol (CBN), cannabicyclol (CBL) and their respective acidic forms. We used selected ion monitoring (SIM) for quantitation and simultaneous positive and negative scans for identification.
Equipment and Materials
Experiments were performed using an integrated HPLC and a single quadrupole LC-MS detector with electrospray ionization (ESI) interface. A mixture of 16 cannabinoids was prepared using an 11-component cannabinoid mixture with five additional individual cannabinoids. LC-MS grade solvents, formic acid and ammonium formate, and degassed deionized water (>18.0 MΩ-cm) were used.
(−)-Δ9-THC-D3 (THC-D3) and (±)-11-nor-9-Carboxy-Δ9-THC-D3 (THCCOOH-D3) were used as internal standards for cannabinoids ionized in positive mode and negative mode, respectively. 50 ppb internal standards (IS) solution consisting of both THC-D3 and THCCOOH-D3 was prepared with 90% mobile phase B and 10% DI. Standards of different concentrations were prepared by diluting stock standards with IS solution.
Hemp Flower Sample Extraction Steps
- Weigh 200 mg into a 50 mL centrifuge tube.
- Add two 9.5 mm O.D. steel balls into the tube.
- Shake at 1000 rpm for 5 min using 2010 Geno/Grinder to grind the sample thoroughly into a fine powder.
- Add 20 mL of methanol into the tube, vortex 1 min, wait for 15 minutes.
- Vortex 1 min again, wait for another 15 minutes.
- Vortex the mixture for 30 seconds, transfer 100 µL supernatant into a 50 mL centrifuge tube, add 9.9 mL methanol and vortex for 30 seconds to make a 100X dilution of the sample.
- Filter the diluted sample using a 0.45 µm syringe filter.
HPLC-MS Conditions
The method conditions for both HPLC and MS are shown in Table 1.

Table 1: Method Conditions
Results and Discussion
For this study, SIM, in both positive and negative modes, was used for building quantitative standard curves for each compound. In addition, SID was simultaneously performed in both positive and negative scan mode for target confirmation.
Figure 1 shows the separation results of 16 cannabinoids using SIM mode. Under the conditions of the experiment, neutral cannabinoids ionize in positive mode, while their respective acidic forms ionize in negative mode. In a previous experiment, CBD and CBG were shown to co-elute from the column; while their molecular weights differ, identification using SID fragmentation and mass identification can be obtained from mass spectra as shown in Figure 2. Target formula weights and adduct ions are shown in Table 2. In order to evaluate the method, linearity, repeatability, method accuracy and method detection limits (MDL) were also determined.
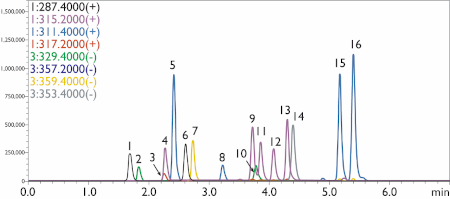
Figure 1: Chromatogram of 16 cannabinoid standards mixture (1 ppm each). Peaks: 1. CBDV, 2. CBDVA, 3. CBG, 4. CBD, 5. CBDA, 6. THCV, 7. CBGA, 8. CBN, 9. ∆9-THC, 10. THCVA, 11. ∆8-THC, 12. CBC, 13. CBL, 14. CBNA, 15. THCA, 16. CBCA
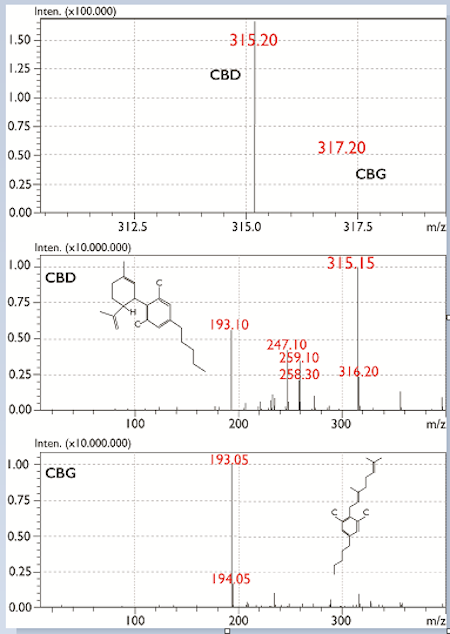
Figure 2: Electrospray mass spectra and in-source fragmentation of CBD and CBD.
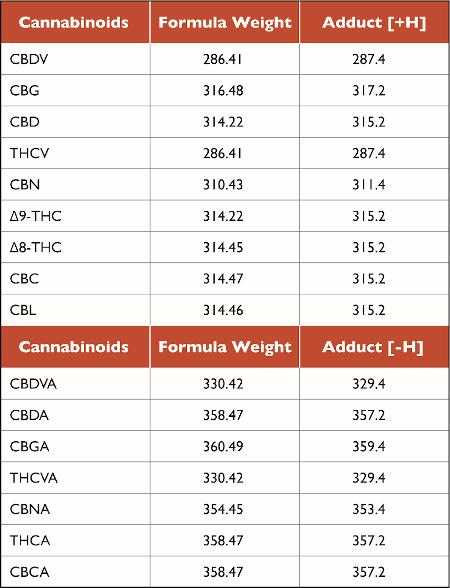
Table 2: Target formula weights and adduct ions
Linearity
Standard curves were established using the peak area ratio of the cannabinoids to their corresponding internal standard versus the concentration ratio of the cannabinoids and internal standard across the concentration range of 10 to 1000 ppb. A correlation coefficient r2 > 0.999 was obtained for all 16 cannabinoids as shown in Figure 3.

Figure 3: Standard curves for 16 cannabinoids.
Repeatability and Accuracy
Table 3 shows retention time precision and peak area precision of 16 cannabinoids from seven injections of the mixed standard. As shown in the table, excellent method repeatability was obtained with retention time relative standard deviations (RSDs) less than 0.05% and peak area RSDs from 0.5% to 3.6%. The method accuracy was investigated by spiking standards with a 100 ppb concentration for each compound into a blank matrix. Acceptable recoveries from 85% to 97% were obtained for all 16 cannabinoids.
Method Detection Limit
Method detection limit (MDL) is defined as the minimum concentration of a compound that can be measured with 99% confidence that its concentration is distinguishable from a blank. The MDL was determined by making seven replicate injections of MDL standards (conc. 3 to 5 times greater than the instrument detection limit). The MDL was calculated as (t) x (S), where t is student’s t value for 99% confidence level (t = 3.14 for seven replicates) and S is standard deviation from seven injections. The MDL standard concentration and calculated MDL are shown in Table 4. The MDL study shows that a level of less than 0.5 ppb for ∆9-THC, ∆8-THC and THCA can be determined with 99% confidence using this method.
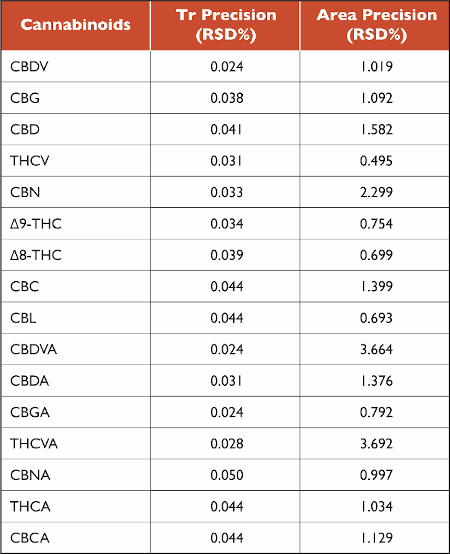
Table 3: Retention time and peak area repeatability
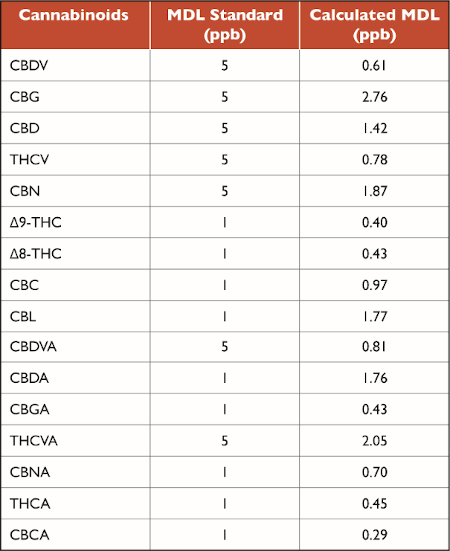
Table 4: MDL standard concentration and MDL
Hemp Flower Analysis
Figure 4 shows the chromatogram of a hemp flower sample obtained from an online vendor of industrial hemp. A Certificate of Analysis (CoA) was provided by the vendor. As shown in Table 5, concentrations of CBD and CBDA obtained in this study agree with the concentrations shown in the CoA. However, detectable quantities of ∆8- and ∆9-THC were found, while the vendor’s CoA did not mention ∆8-THC and reported that ∆9-THC was not detected. In addition, THCA was found to be 1.2%.
According to the latest regulation (7 CFR Part 990 [Doc. No. AMS-SC-19-0042; SC19-990-2 IR] Establishment of a Domestic Hemp Production Program), this sample would be classified as cannabis and not hemp, as its total THC content derived from THCA and ∆9-THC exceeds the 0.3% guideline. This illustrates the advantage of the LCMS method for its sensitivity and specificity in determining cannabinoids.
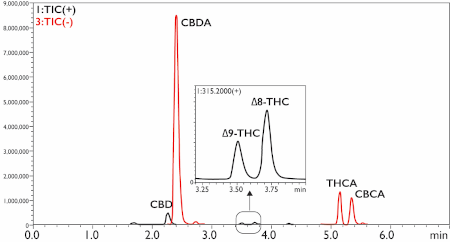
Figure 4: Hemp flower analysis using LC-ESI-MS.

Table 5: Hemp flower analysis
Conclusion
A quantitative LC-MS method for the determination of 16 cannabinoids, including ∆9-THC, ∆8-THC, CBD, CBG, CBN, CBL and their respective acidic forms, was developed using a single quadruple LC-MS with an integrated LC front end. This method demonstrates the increased sensitivity and specificity of mass spectrometry for the analysis of cannabinoids in industrial hemp.
Rachel Lieberman is the Forensics Marketing Manager, Hui Guo is an HPLC Applications Scientist, and Craig Young is the HPLC Product Manager at Shimadzu Scientific Instruments in Columbia, Maryland. Correspondence can be sent to Dr. Lieberman at [email protected]