Featured Article

An estimated 21.5 million Americans aged 12 and above had a substanceuse disorder in 2014; 1.9 million had a substance-use disorder involving prescription pain relievers.1 Although they may differ in chemical structure,2 all compounds that exert morphine-like action are covered by the term “opioid.” Included in this group are the endogenous opioids (endorphins, encephalin and dynorphins); natural opioids such as codeine and morphine; semisynthetic opioids such as hydrocodone, hydromorphone, oxycodone, oxymorphone and buprenorphine; and synthetic opioids such as methadone, fentanyl, meperidine (Demerol) and cis-tramadol. Naloxone and naltrexone, opioid receptor antagonists, are frequently encountered when testing for opiates. All opioids share analgesic properties and work by binding to the G-protein-coupled opioid receptors (μ, ĸ, ð) in the central nervous system, peripheral tissues and reproductive tract, where they relieve pain; induce sedation, euphoria and pupillary constriction (miosis); reduce gut motility, resulting in constipation; and cause respiratory depression, which, in cases of overdose, is the mechanism by which death commonly occurs.2
Urine collection is less invasive and more convenient than other methods of obtaining samples for the detection of substance-use disorder; numerous parent drugs and their metabolites can be uncovered. Many drugs can be detected in urine for from a few days up to a week following last use, depending on its half-life, excretion pattern and the sensitivity of the analytical method.3 Opioids can be detected for longer periods of time and at higher concentrations in urine than in many other biological matrices. Urine has become the most common biological sample for drug detection in pre-employment, random testing, return to duty, follow-up pain management, sports medicine and criminal cases.3,4 Society of Forensic Toxicologists and American Academy of Forensic Scientists guidelines stipulate that the detection of drugs in urine must include a second method as a confirmatory test based on a chemical principle that differs from the initial (screening) method.3,5 Liquid chromatography coupled to mass spectrometry is an example of such an approach and is being used increasingly for the identification and quantitation of polar, thermally labile, low-dosed drugs.4
Opioids are commonly prescribed for postsurgical pain or trauma but are often abused.6 Physicians order urine opioid confirmations in clinical settings to evaluate compliance, especially if the patient is in a pain-management program or has signed an agreement not to take drugs other than those prescribed.6 Increased emphasis has been placed on testing employees to ensure a drug-free workplace, but many company-run programs are not consistent with established forensic protocols. Employees may be unfairly terminated on the basis of inaccurate interpretations arising from the lack of confirmatory test analysis, analytical error, etc.7
Due to opioids’ structural similarities and isomeric characteristics, identification in biological matrices can be challenging.3 Conventional methods such as immunoassays lack specificity and require confirmatory results obtained by more definitive techniques like GC/MS or LC/MS.8 GC/MS is problematic for thermally labile, polar and nonvolatile solutes, which require derivatization and, hence, increased sample analysis time.7 LC/MS is amenable to such solutes and requires only a sample cleanup step such as solid-phase extraction (SPE) to remove the analytes of interest from the biological matrix. SPE is essential for minimizing ion suppression or matrix effects, extending column lifetime and reducing contaminants in the MS source.8
Reversed-phase chromatography (RPC), most commonly used for the analysis of basic drugs in urine (such as pain management and related compounds), suffers from incomplete resolution of certain solutes of interest,9–11 which can lead to ambiguous identifications, and ion suppression when employing electrospray MS detection. For the separation of the basic drugs in the drug panel required by the Substance Abuse and Mental Health Services Administration (SAMHSA), use of a complementary separation technique such as hydrophilic interaction chromatography (HILIC) can result in baseline separation of all the solutes of interest.8 RPC and HILIC required the use of two columns and different elution solvents, which are not necessary when using a pentafluorophenyl (PFP) column, which exhibits “U-shaped” retention behavior (retention decreases and then increases with organic modifier concentration).8,12 Ten basic drugs in the SAMHSA panel were fully resolved using a 2.7-μm superficially porous PFP column with different combinations of the same solutions in solvent reservoirs A and B operating in both RPC and HILIC mode.
This study describes the development of methodology for the analysis of 13 analgesics in urine employing complementary RPC- and HILIC-ultrahigh-performance liquid chromatography (UHPLC) modes coupled to time-of-flight-MS (TOF-MS), post-SPE, on a single PFP column combining the same solvents from two solvent reservoirs. Methodology used in a published study to analyze basic compounds in the SAMHSA5 drug panel8 was partially adopted.
Experimental
Chemicals and reagents
Reference drug standards (1.0 mg/mL in methanol) and synthetic urine were obtained from Cerilliant (Round Rock, Texas). Agilent (Palo Alto, Calif.) and electrospray ionization (ESI) tuning mix was from PerkinElmer (Shelton, Conn.). LC/MS-grade water, formic acid, acetonitrile (ACN) and certified ACS plus ammonium hydroxide were obtained from Fisher Scientific (Fairlawn, N.J.).
Buffers were prepared from stock solutions both for use during SPE and as mobile-phase components. Two stock buffers were prepared during the study: 200 mM ammonium formate (pH ~3) and 100 mM ammonium acetate (pH ~6.4).8
Instrumentation and data analysis
The UHPLC-TOF-MS system consisted of a Flexar 15 liquid chromatograph coupled with an Axion 2 TOF-MS (PerkinElmer). Chromera version 3.4.1 and TOF-MS driver version 6.1 software (PerkinElmer) were used for instrument control, data acquisition and processing. UHPLC chromatographic separations were performed using a PerkinElmer PFP column (150 mm × 2.1 mm, 2.7 μm). Solvent reservoir A contained 5 mM ammonium formate in acetonitrile:water (1:9); solvent reservoir B contained 5 mM ammonium formate in acetonitrile:water (9.5:0.5). For RPC and HILIC separations, flow rate and temperature were 0.3 mL/min and 25 °C, respectively. An injection volume of 1 μL with an 18-minute gradient from 100%A to 100%B was used for RPC. For HILIC, an injection volume of 2.5 μL was used with a mobile phase consisting of 10%A and 90%B. For positive electrospray ionization (ESI+) TOF-MS detection, the dry gas heater for nitrogen was set at 325 °C with a gas flow of 14.0 L/min, capillary exit voltage was 90 V and MS data was acquired in full-scan mode from 100 to 1000 m/z at 3 spectra/ second. External calibration was carried out using the ESI tuning mix diluted 1:10. MS parameters for the drugs examined are given in Table 1.
Table 1 – Mass spectrometric parameters of pain-management drugs

A Rocker 115-V vacuum pump was used for the manifold setup for SPE, with a Precise-Bed Technology Supra Clean Mixed-Mode (MM1) column (vacuum pump and column from PerkinElmer).
Procedures
Previously reported procedures were followed for SPE, sample recovery, determination of ion suppression and ion enhancement, linearity and limit of detection.10
Results
UHPLC-TOF-MS separation of pain-management drugs
The 13 pain-management drugs were separated on a PFP column by RPC and HILIC using the same solutions from two solvent reservoirs at different ratios (Figure 1). For RPC with TOF-MS detection, there is coelution between naloxone and codeine, naltrexone and oxycodone, and buprenorphine and fentanyl. Ion suppression will therefore be present, depending on the relative concentrations of the coeluting analytes. Despite significant overlapping peaks, coeluting solutes via RPC are fully resolved using HILIC. Full resolution of all 13 analgesics is observed from a combination of both separation mechanisms, each complementary to the other. Enhanced dipole, π–π, charge transfer and ion-exchange interactions contributed to the unique selectivity of the PFP stationary phase.12
 Figure 1 – Extracted ion chromatograms of a standard mixture of pain-management drugs (2000 ng/mL each) for A) RPC and B) HILIC separations. Peaks: a) morphine, b) oxymorphone, c) hydromorphone, d) codeine, e) naloxone, f) oxycodone, g) naltrexone, h) hydrocodone, i) cis-tramadol, j) meperidine, k) fentanyl, l) buprenorphine, m) methadone. See experimental section for UHPLC-TOF-MS conditions.
SPE
SPE using an MM1 column (silica, reversed-phase/strong cation exchange) was used to eliminate several potentially interfering components of urine such as creatine, creatinine and urea.8 Ion suppression and ion enhancement were minimized, and cleanliness of the column and TOF ion source was preserved. The extraction solvent, consisting of ammonium hydroxide and acetonitrile (20:80, v/v), was chosen to provide good recovery of the analytes of interest and to allow direct injection of the SPE extract into the PFP column under RPC and HILIC conditions. Ammonium hydroxide minimizes ion-exchange interactions between the protonated basic analytes and the strong cation-exchange sites on the solid-phase column. This is done by converting the solutes (depending on the apparent pH of the extraction solvent) to predominantly its un-ionized state; in addition, the ammonium ion can act as a competing ion. Direct injection of the extract into the analytical instrument minimizes total sample analysis time because it obviates the need for evaporative and reconstitution steps, which would be required if a nonaqueous compatible organic solvent such as methylene chloride was used. A mismatch of solvent strength and apparent pH of extracted solvent with the starting mobile phase solvent for gradient RPC and isocratic conditions for HILIC limited the injection volumes to 1 and 2.5 μL, respectively.
Method validation
Recovery, ion suppression and ion enhancement data for pain-management drugs after SPE are shown in Table 2. Good overall recovery of 75.0 ≤% recovery ≤109.5 was obtained for all analytes. Recovery losses or gains can be explained in part by the reproducibility of the retention peak areas (% RSD) of the pre- and postextraction spiked urine samples. Generally, minimal ion suppression and ion enhancement was obtained for RPC and HILIC after SPE (93.9 ≤% ion suppression/ion enhancement ≤115.7). For oxycodone, % ion suppression/ ion enhancement values of 133.5 and 118.9, respectively, were obtained for RPC and HILIC.
Table 2 – Recovery, ion suppression and ion enhancement data for UHPLC-RPC-TOF-MS and UHPLC-HILIC-TOF-MS separations of drugs and metabolites described in experimental section

Linearity and limit of detection data for the 13 drugs is shown in Table 3 for RPC and HILIC. Using both chromatographic systems, the analytes exhibited linearity with R2 ≥ 0.99. Many of the drugs exhibited linearity over two orders of magnitude, whereas the remaining solutes are linear over a range of well over an order of magnitude. With the exception of buprenorphine by HILIC, all analytes met the limit of detection (LOD) of the commonly employed initial test and cutoff concentrations by both RPC and HILIC methods (Table 3).13–19
Table 3 – Linearity data for UHPLC-RPC-TOF-MS and UHPLC-HILIC-TOF-MS separations of drugs described in experimental section and current cutoff concentrations employed by toxicology laboratories and regulatory bodies
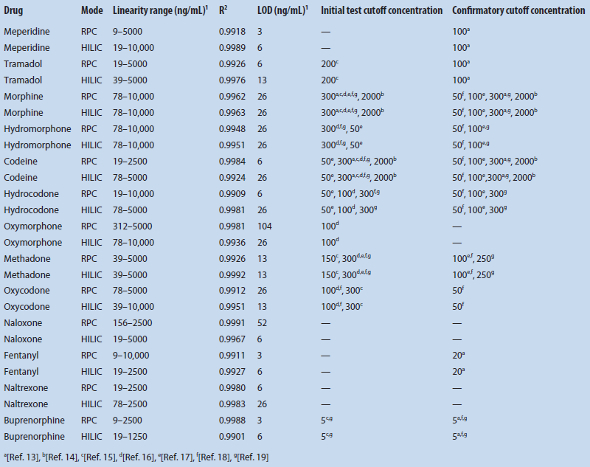
Since the high organic content in HILIC favors MS ionization versus RPC, the LOQ of both chromatographic modes was compared. Taking into account the injection sizes and different peak widths, as in a previous study,8 most of the pain-management drugs had lower limits of detection by RPC than by HILIC~ ≤ 8×).
Orthogonality of RPC and HILIC separations
Figure 2 is a plot of the relative retention times (RRTs) determined by HILIC versus RPC of the 13 drugs studied. The R2 value for a scatterplot of the RRT HILIC and RRT RPC of 0.7696 (Figure 2) indicates that the separation techniques are weakly correlated. In a previous study of the separation of the basic compounds in the SAMHSA-5 drug panel and “bath salts” using “flip-flop” chromatography with the SPP-PFP stationary phase, more poorly correlated separations were produced, with R2 values of 0.0839 and 0.3948, respectively.8 A combination of analyte type, buffer type and concentration, apparent pH and % acetonitrile can play a role in the separation differences between RPC and HILIC.
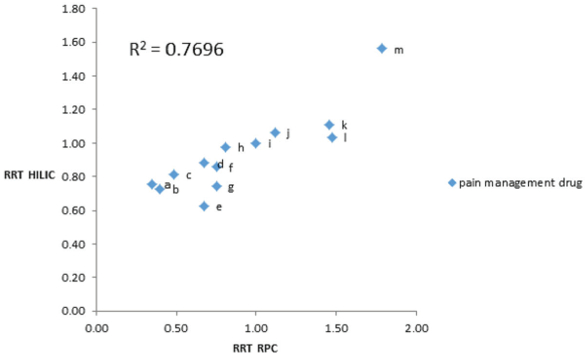 Figure 2 – Scatterplot of RRT HILIC versus RRT RPC for pain-management drugs. Retention times relative to cis-tramadol. See Figure 1 for drug identities, and experimental section for UHPLC-TOF-MS conditions.
Conclusion
Methodology for the analysis of 13 analgesics in urine enhances separation selectivity and solute identification, and minimizes ion suppression, sample preparation and analysis time, while utilizing a single column and the same mobile phase solvents in both RPC and HILIC modes in one run. This rapid and easy-to-implement technique, employing a single column with the same solvent reservoir solutions, can also be applied to the analysis of analytes in metabonomics, pharmacokinetic studies, therapeutic drug monitoring, clinical diagnostics and seized drugs.
References
- American Society of Addiction Medicine (ASAM). Opioid addiction 2016 facts and figures. ASAM 2016, 1.
- French, D.; Wu, A. et al. The challenges of LC-MS/MS analysis of opiates and opioids in urine. Future Science 2013, 5, 2803.
- Concheiro, M.; de Castro, A. et al. Determination of illicit drugs and their metabolites in human urine by liquid chromatography tandem mass spectrometry including relative ion intensity criterion. J. Anal. Toxicol. 2007, 31, 573.
- Kolmonen, M.; Leinonen, A. et al. Hydrophilic interaction liquid chromatography and accurate mass measurement for quantification and confirmation of morphine, codeine and their glucuronide conjugates in human urine. J. Chromatogr. B: Anal. Technl. Biomed. Life Sci. 2010, 878, 2959.
- Fitzgerald, R.L.; Griffin, T.L. et al. Dilute and shoot: analysis of drugs of abuse using selected reaction monitoring for quantification and full scan product ion spectra for identification. J. Anal. Toxicol. 2012, 3, 106.
- French, D.; Wu, A. et al. Hydrophilic interaction LC-MS/MS analysis of opioids in urine: significance of glucuronide metabolites. Future Science 2011, 3, 2603.
- Houck, M.M. and Siegel, J.A. Fundamentals of Forensic Science, 3rd ed. Elsevier, 2015.
- Clyde, C.; Blake, S. et al. Application of mixed-mode ultra high performance liquid chromatography to forensic drug analysis. Anal. Methods 2015, 7, 9763.
- Gergov, M.; Nokua, P. et al. Simultaneous screening and quantification of 25 opioid drugs in post-mortem blood and urine by liquid chromatography-tandem mass spectrometry. Forensic Sci. Int. 2009, 186, 36.
- Pike, E.; Sanchez, C. et al. Development of a high-throughput LCMS- MS assay for 13 commonly prescribed pain management drugs from urine with cleanup using solid phase extraction (SPE). LC·GC North America 2010, 8, 34.
- Cao, Z.; Kaleta, E. et al. Simultaneous quantitation of 78 drug and metabolites in urine with a dilute-and-shoot LC-MS-MS assay. J. Anal. Toxicol. 2015, 39, 335.
- Bell, D.S. and Jones, A.D. Solute attributes and molecular interactions contributing to “U-shape” retention on a fluorinated highperformance liquid chromatography stationary phase. J. Chromatogr A 2005, 107, 99.
- https://www.marshfieldlabs.org/sites/ltrm/Human/Documents/Forms/AllItems.aspx.
- Mandatory Guidelines for Federal Workplace Drug Testing Programs. Fed. Reg., November 25, 2008, 73 FR 71858, section 3.4.
- https://www.redwoodtoxicology.com/resources/cutoffs_methods/screen-confirm_urine
- White, R.M. and Black, M.L. Pain management testing reference, American Association for Clinical Chemistry, Inc., Washington, D.C., 2007.
- Moore, C.; Marinetti, L. et al. Analysis of pain management drugs, specifically fentanyl, in hair: application to forensic specimens. Forensic Sci. Int., 2008, 176, 47.
- https://www.communitycarenc.org/media/tool-resource-files/interpreting-urine-toxicology-screens14.pdf.
- London Toxicology Group European laboratory guidelines for legally defensible workplace drug testing. EWDTS 2002, 1, 37.
Ihuoma A. Igwilo, M.B.B.S., M.Sc., is a graduate student; Nicholas T. Lappas, Ph.D., is an associate professor; and Ira S. Lurie, Ph.D., is a research professor, all at Department of Forensic Sciences, George Washington University, 2100 Foxhall Rd., N.W., Somer’s Hall, lower level, L-12, Washington, D.C. 20007, U.S.A.; tel.: 202-994-3791; [email protected]; www.gwu.edu. The authors thank PerkinElmer Corporation for donating the UHPLC and solidphase extraction columns, loan of the solid-phase extraction device and financial support for the laboratory through GWU Proposal #13-04142.