Featured Article
In the early years, regulations for medical marijuana focused on the aspects of production, possession, and prescription.1 There was little if any regulatory incentive to analyze cannabis samples for anything other than the major cannabinoids. When Colorado and Washington legalized adult-use marijuana in 2012,2,3 interest in testing cannabis and related products such as concentrates and edibles grew dramatically. While cannabis samples are analyzed for a variety of items such as potency, terpenes, microbial contamination, metals, and residual solvents, the most controversy has been related to the amount of pesticides (a term used to describe pesticides, miticides, plant growth regulators, and fungicides) present in cannabis samples.4 Pesticides are a major concern to consumers and regulators due to the unknown health effects of many of these compounds, especially when inhaled.5
High-performance liquid chromatography-tandem mass spectrometry (LC-MS/MS) has emerged as the method of choice for pesticide analysis because it offers superior selectivity, sensitivity, and ruggedness and does not require extensive sample preparation before analysis. Methods have been described for the analysis of pesticides in cannabis samples using gas chromatography-tandem mass spectrometry (GC-MS/MS) that perform well but in general are applied to a smaller number of analytes than LC-MS/MS. Moreover, GC-MS/MS methods are not as robust as LC-MS/MS methods, especially in complex matrices,6,7 and some compounds, such as abamectin, are not amenable to analysis by GC-MS/MS because they are heat labile and degrade in the injection source.
Analysis of pesticides in cannabis has been complicated by the lack of federal guidance. States have struggled to develop clear testing guidelines, and the testing requirements change as the industry evolves.8,9 The industry has responded to customer requirements for pesticide analysis, and several laboratories offer these services using LC-MS/MS analyses.
Experimental
Samples were extracted via either QuEChERS or solvent extraction using 1 g of sample extracted into 5 mL of methanol. An Exion LC AD system attached to a QTRAP 6500+ system or Triple Quad 3500 system (all from SCIEX, Framingham, MA) were used to analyze the samples. The LOQ (limit of quantitation) data were obtained using a QTRAP 6500+, and sample analyses were performed on a Triple Quad 3500. Separations were performed on a Raptor ARC-18 column (Restek, Bellefonte, PA) or Kinetex C18 column (Phenomenex, Torrance, CA) using 0.1% formic acid + 5 mM ammonium formate in water: 0.1% formic acid + 5 mM ammonium formate in methanol gradient.
Discussion
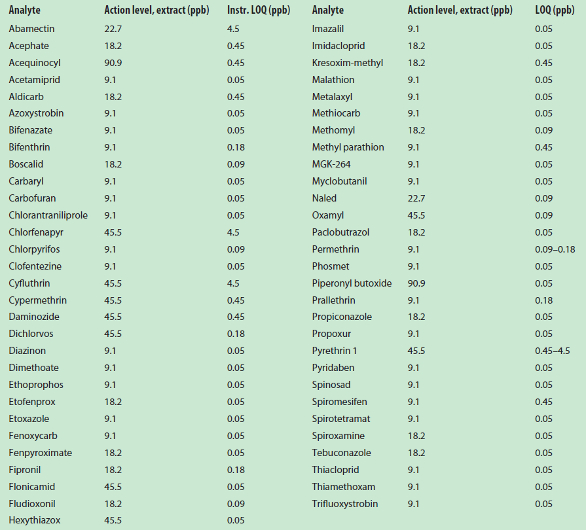
The first question for any method development project is: What are the target analytes and what is the maximum residual limit (MRL)? As regards pesticide analysis for cannabis, this is a more complex issue than may be expected, mainly due to the lack of federal guidelines from agencies such as the USDA that issue pesticide residue levels for crops. These agencies cannot issue guidelines for cannabis because it is an illegal substance, which leaves each state to develop its own regulations, and results in different guidelines and compound lists. The State of Oregon, however, has developed a list of 59 compounds with MRLs and is, to date, the only state to provide such a list.10 Others are working to develop lists as well and, fortunately, these lists have been subsets of the Oregon list. Therefore, laboratories interested in providing pesticide analyses will ultimately need to have the capability to analyze these compounds.
All of the compounds on the list can be detected using LC-MS/MS, in contrast to GC-MS/MS, where some of the compounds require derivatization to survive the injection port. Typical LC-MS/MS instrumental LOQs are shown in Table 1. This table shows LOQs when the compounds are analyzed in a solvent. An LOQ of 4.5 ppb corresponds to a plant concentration of 0.1 ppm using a 0.25-g sample size. In general, LC-MS/MS can detect compounds at concentrations approximately two orders of magnitude below the required action levels. Most of the compounds on the Oregon list are easily analyzed by LC-MS/MS in matrix, but some—such as the pyrethrins, cyfluthrin, and acequinocyl—require more careful method optimization of the chromatographic conditions to separate matrix interferences from the target analytes. These data demonstrate that LC-MS/MS methods can provide adequate sensitivity for the analysis of pesticides in cannabis samples.
Table 1 – Limits of detection in solvent for compounds on the Oregon list demonstrating the suitability of LC-MS/MS for all compounds
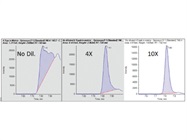
Sensitivity is also useful because it allows for greater dilutions of extracts while still able to meet the required action-limit detection levels. The complexity of the cannabis matrix often causes peak shape problems that can interfere with the detection of a compound. In these situations, diluting the extract can greatly improve the peak shape, but it is important that the instrumental sensitivity is sufficient to still allow for the MRL to be achieved with the dilution. The effect of dilution can be seen in Figure 1. In this figure, a plant extract was spiked to a concentration of 4.5 ppb with Spinosyn D, an isomer in Spinosad. This concentration corresponds to a plant concentration of 0.1 ppm, which is half the action level of 0.2 ppm (9.1 ppb in the extract); the action level for this compound is 9.1 ppb. The peak from an undiluted extract, a 4× dilution and a 10× dilution, are shown. These data are for Spinosyn D and the corresponding Oregon action level for the extract is 9.1 ppb. Clearly, it is not possible to measure the peak area in the undiluted sample. It is possible, however, to measure an accurate peak area at both 4× and 10× dilution. The data also indicate that the LC-MS/MS has sufficient sensitivity to analyze much lower concentrations than is required by the state’s action limits.
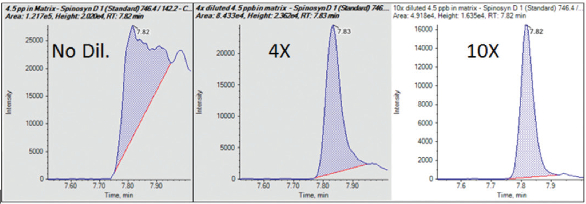 Figure 1 – Effect of extract dilution on the peak shape for Spinosyn D spiked into a cannabis flower extract to a concentration of 4.5 ppb or 0.1 ppm in the plant.
Figure 2 shows the data for myclobutanil, one of the most common chemicals found in cannabis samples due to its effectiveness as a fungicide. The data show the results for a flower extract that has been spiked to a concentration of 0.45 ppb (0.01 ppm in the plant). For this compound, the Oregon action level is 0.2 ppm, which is 20 times higher than the spiked level. These data show the excellent sensitivity and linearity achieved using LC-MS/ MS, even at concentrations well below the action limits. The three peaks in the top pane of the figure are three replicate injections of a flower extract spiked to a concentration of 0.45 ppb. This demonstrates the outstanding precision that is achievable in matrix using LC-MS/MS. The data from Figures 1 and 2 are typical of the performance for most compounds on the Oregon list, and show suitability of LC-MS/MS for this analysis.
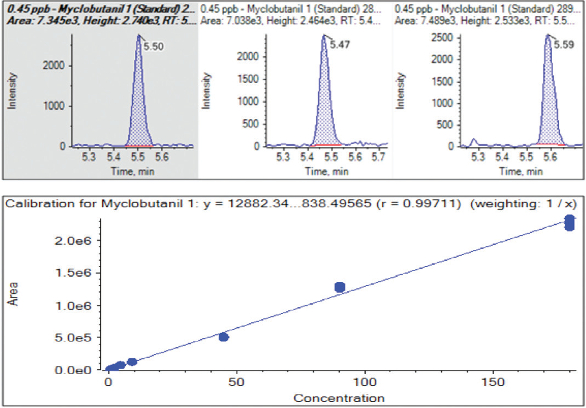 Figure 2 – Data from a flower extract spiked with myclobutanil at 0.45 ppb (0.01 ppm in plant) showing excellent linearity and precision at low concentrations in a complex matrix.
Possibly the most important criterion for analysis in a production laboratory is the ruggedness of the method. Figure 3 shows the peak areas for the quantitation transition for 12 compounds from a 20-ppb QC check sample analyzed as a calibration check during the analysis of sample extracts. These are raw peak areas, and not peak ratios, using an internal standard. The data show the area for these compounds over a three-month period representing approximately 9000 injections, and demonstrate the ruggedness and stability that can be expected for LC-MS/MS over extended periods of time in actual production. During this time, solvent was replaced daily, guard columns were replaced weekly, the ion source orifice was rinsed every two weeks, and the analytical column was replaced monthly. None of these maintenance procedures removed the instrument from service and did not affect laboratory productivity. The data show that the response drift was well below the 20% QC requirement set by the laboratory, and demonstrate the remarkable ruggedness that is possible with a properly developed LC-MS/MS method.
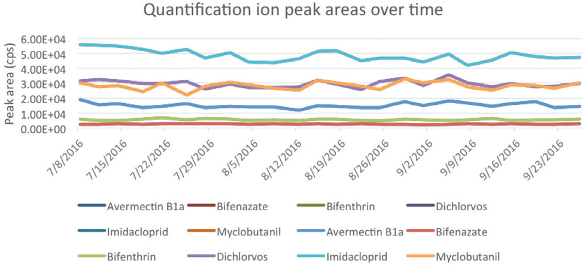 Figure 3 – Stability of peak areas for the quantitation transition for 12 compounds in a 20-ppb QC check standard over a three-month period.
Results observed over a two-month period involving over 5000 samples are depicted in Figure 4. The chart shows the percentage of samples that were found to have a pesticide concentration in the plant above 100 ppb. Piperonyl butoxide is the most commonly found chemical—not surprising as it is one of the few compounds approved for use in states with legalized adult-use marijuana. Piperonyl butoxide is usually used in conjunction with pyrethrins to improve their effectiveness. The second most abundant compound found in cannabis is myclobutanil and reflects the effectiveness of this compound to protect crops from spoilage. What is perhaps more interesting is the large number of compounds that were actually detected in these samples. Clearly, this indicates that many compounds that are not allowed for use on cannabis are still in widespread use. These data also stress the need for states to develop effective testing procedures for the cannabis industry.
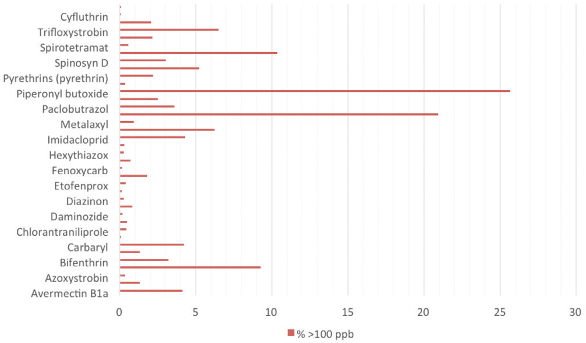 Figure 4 – Results from the analysis of over 5000 cannabis samples showing the percentage of samples that had concentrations of pesticides above 100 ppb.
Conclusion
The data presented in this article demonstrate that an LC-MS/MS method can be used for the analysis of all 59 compounds from the Oregon pesticide list. LC-MS/MS provided excellent selectivity, sensitivity, and robustness over several months. The data from over 5000 sample analyses show that many of these compounds are found in a variety of cannabis samples and support the need for thorough and accurate testing.
References
- http://a2c2.us/the-laws/compassionate-use-act-of-1996-prop-215/
- https://www.colorado.gov/pacific/enforcement/laws-constitutionstatutes- and-regulations-marijuana-enforcement
- http://lcb.wa.gov/mj-education/know-the-law
- http://www.denverpost.com/2016/05/01/colorado-pot-industrysteps- up-pesticide-fight-against-regulators
- https://www.theatlantic.com/health/archive/2015/08/pot-marijuanapesticide- legalization/401771
- http://american-safe-access.s3.amazonaws.com/documents/AHP_ Cannabis_Monograph_Preview.pdf
- https://www.aocs.org/stay-informed/read-inform/featured-articles/ the-highs-and-lows-of-cannabis-testing-october-2016
- http://www.oregon.gov/oha/news/Pages/OHA%20to%20change%20 testing%20standards%20for%20marijuana%20products.aspx
- http://www.denverpost.com/2015/10/03/colorado-yields-to-marijuanaindustry- pressure-on-pesticides/
- https://public.health.oregon.gov/PreventionWellness/marijuana/Documents/oha-8964-technical-report-marijuana-contaminant-testing.pdf
Paul C. Winkler, Craig Butt, and April Quinn-Paquet are with SCIEX, 500 Old Connecticut Path, Framingham, MA 01701, U.S.A.; tel.: 650-631-2132; e-mail: [email protected]; www.sciex.com. David Egerton is with CW Analytical Laboratories, Oakland, CA, U.S.A. Phil Taylor is with SCIEX, Warrington, U.K. K.C. Hyland and David Monk are with SCIEX, Redwood City, CA.